Site pages
Current course
Participants
General
Module 1. Micro-irrigation
Module 2. Drip Irrigation System Design and Instal...
Module 3. Sprinkler Irrigation
Module 4. Fertigation System
Module 5. Quality Assurance & Economic Analysis
Module 6. Automation of Micro Irrigation System
Module 7. Greenhouse/Polyhouse Technology
12 April - 18 April
19 April - 25 April
26 April - 2 May
Lesson 13. Sprinkler Performance Evaluation
The basic purpose of sprinkler irrigation is to apply uniform depth of water to the field crop. The water distribution pattern of a sprinkler nozzle is tested with the sprinkler operating individually under a set of specific conditions. Operating pressure and nozzle geometry (i.e., nozzle opening size, shape, and angle) are the primary factors that control the operation of sprinklers. The performance of a sprinkler is described by its discharge, distance of throw, distribution pattern, application rate and droplet size.
13.1 Sprinkler Discharge, Distance of Throw and Application Rate
i) Sprinkler Discharge: Sprinkler discharge is the volume of water passing out of the sprinkler nozzle. Common units for sprinkler discharge are liters per minute (1/min) and gallons per minute (gpm) in the SI and English systems, respectively. Equation 13.1 can be used to relate sprinkler discharge to operating pressure and nozzle geometry.
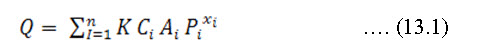
Where,
Q = sprinkler discharge;
n = number of nozzles;
K = constant that depends on unit used;
C = coefficient that depends on shape and roughness of opening in nozzle i;
A = cross-sectional area of the opening in nozzle i;
P = operating pressure in nozzle i;
exponent for nozzle i.
Thus, discharge of a multi nozzle sprinkler is the sum of the nozzle discharges.
Values of C and for each nozzle and normally determined empirically. Since is about 0.5 for most sprinklers, higher pressures and/ or larger nozzle openings will increase sprinkler discharge. Sprinkler manufactures commonly publish tables of pressure and discharge data for various nozzle diameters. Sprinkler discharge is not related to nozzle angle.
ii) Distance of Throw: The spacing between adjacent sprinklers depends, in part, on the distance sprinklers throw water. Spacing usually increases as the distance of throw rises.
The operating pressure, and size, shape and angle of the nozzle opening determine the distance a sprinkler throws water. Distance of throw also tends to increase as nozzle size increases (other things remaining constant). Nozzles opening shapes that create smaller diameter droplets tend to wet a smaller area than nozzle that emit larger droplets. Distance of throw usually increases and then declines as nozzle angle rises above horizontal. Sprinkler manufactures commonly publish wetted diameter or other measures of distance of throw for different operating pressures, and nozzle sizes, shapes, and angles.
iii) Application rate: Application rate is an extremely important parameter that is used to properly match sprinklers to the soil, crop, and terrain on which they operate. When sprinkler application rates are too high, runoff and erosion can occur. Application rate has dimensions of length per unit time. The average application rate of an individual sprinkler can be computed using Eq. 13.2
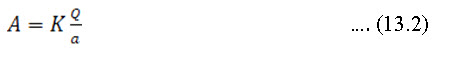
Where
A = application rate (mmh-1, inh-1);
Q = sprinkler discharge (Lmin-1, gmin-1)
a = wetted area of sprinkler (m,2 ft2)
K = unit constant (K= 60.0 for A in mm/h, Q in Lmin-1, and a in m2.
K = 96.3 for A in inh-1 , Q in gmin-1, and a in ft2).
When several identical sprinklers are spaced in a L by S grid. Eq. 13.3 can be used to compute the average application rate.
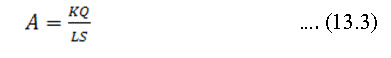
where
A = application rate (mm/h, in/h);
Q = discharge of individual sprinklers
L = distance between sprinklers along the lateral (m)
S = spacing between adjacent sprinkler lines or lateral set positions (m)
K = K in Eq. 13.2
The average application rate beneath a lateral of sprinklers can be computed using Eq. 13.4
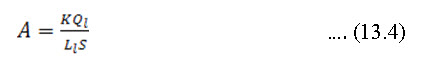
where, A and S are as previously defined
![]() = total flow rate into upstream end of lateral (Lmin-1, gmin-1);
= total flow rate into upstream end of lateral (Lmin-1, gmin-1);
![]() = length of lateral (m, ft);
= length of lateral (m, ft);
K = K in Eq. 13.2
For most sprinklers, variation in operating pressure has little, if any, effect on the average application rate of an individual sprinkler. When operating pressure increases, for example, the increase in Q tends to be offset by the increase in wetted area. The average application rate of several identical overlapping sprinklers, however, tends to be directly related to operating pressure, since L and S remain constant as Q increases. This is also true for the average application rate beneath a sprinkler lateral.
The average application rate for an individual sprinkler varies widely depending upon nozzle geometry. Deflector plate sprinklers, for example have relatively high average application rates, since they wet a much smaller area than relatively high average application rates, since they wet a much smaller area than do other types of sprinklers. Conversely, conventional impact sprinklers are normally designed to achieve the maximum wetted area, and thus lowest possible average application rate. Nozzle opening shapes that create smaller droplets and wet a smaller area tend to have the highest average application rates. Average application rate will usually decrease and then increase as nozzle angle increases above horizontal. Increasing nozzle diameter usually increases the average application rate, since Q normally increases more rapidly than wetted area.
There is also considerable variation in the instantaneous application rate (i.e., the rate at which water is applied to a given point on the soil surface during an instant in time) from sprinkler type to sprinkler type (James and Stillmunkes,1980). Conventional impact sprinklers for example, apply water as a spray that covers all or nearly all of the wetted area continuously. Thus the rate at which water is applied to a given point on the soil surface during an instant of time, the instantaneous application rate, is less for deflector-plate sprinklers than for conventional impact sprinklers. On some soils, lower instantaneous rates of application can decrease the potential for runoff and erosion by reducing soil splash and water ponding on the soil surface.
13.2 Droplet Size
Droplet size is an important factor affecting the formation of ‘‘seals’’ on bare soil surfaces that restrict water movement into the soil. Because small droplets possess less power when they impact the soil surface, ‘‘seals’’ that limit infiltration form more slowly than with larger droplets. For these reasons, it is sometimes possible to reduce runoff and erosion by converting from sprinklers that emit large droplets to ones with smallest droplets.
Droplet size is especially important when sprinklers must operate in winds. Distribution patterns from sprinklers that emit smaller droplets are more subject to wind distortion and lower application uniformity. In addition, increased losses due to wind drift usually occur with small droplet sprinklers.
Higher operating pressures normally increases the volume of water applied as smaller droplets while decreasing the volume of larger droplets. A similar, but a significantly smaller effect occurs on the larger droplets (not on the volume of water) as nozzle opening size is decreased. Nozzle opening shape can have an important effect on droplet size while nozzle angle has little, if any effect.
13.3 Distribution pattern
i) Uniformity coefficients: A measurable index of the degree of uniformity obtainable for any size sprinkler operating under given conditions has been adopted and is known as the uniformity coefficient (Cu). This uniformity coefficient is affected by the pressure nozzle size relations, by sprinkler spacing and by wind conditions. The coefficient is computed from field observations of the depths of water caught in open cans placed at regular intervals within a sprinkled area. It is expressed by the equation developed by Christiansen (1942):
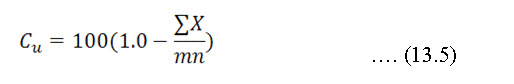
in which
![]() = coefficient of uniformity
= coefficient of uniformity
m = average value of all observations (average application rate), mm
n = total number of observation points
X = numerical deviation of individual observation s from the average application rate, mm.
A uniformity coefficient of 100 per cent (obtained with overlapping sprinklers) is indicative of absolutely uniform application, whereas the water application is less uniform with a lower percentage. A uniformity coefficient of 85 per cent or more is considered to be satisfactory.
ii) Pattern efficiency: The pattern efficiency (also known as distribution efficiency) can be calculated after obtaining the total depths at each of the grid point. The minimum depth is calculated considering average of the lowest one fourth of the cans used in a particular test. Pattern efficiency is given by
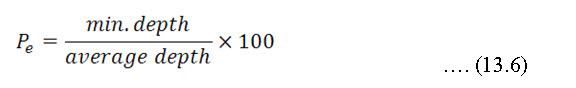
The pattern efficiency is useful in calculating the average depth to be applied for a certain minimum depth. The pattern efficiency is influenced by the wind conditions.
Application 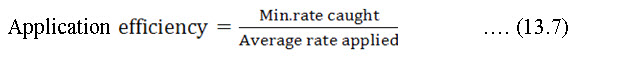
References:
Christiansen, J.E. 1942. Irrigation by Sprinkling. California Agricultural Experiment Station. Bulletin No. 670. Berkeley.
James, L.G., and R. T. Stillmunkes (1980). Instantaneous Application Rates Beneath Center Pivot Irrigation Systems. ASAE Paper PNW 80-206, Great Falls, Mont.
Suggested Reading:
-
James, Larry G (1988). Principles of Farm Irrigation System Design, John Wiley and Sons, Inc., New York, pp.193-197.
-
Michael, A. M., (2010). Irrigation Theory and Practice, Vikas Publishing House PVT Ltd, Delhi, India., pp.578.
Last modified: Saturday, 18 January 2014, 9:19 AM