Site pages
Current course
Participants
General
MODULE 1. Fundamentals of Soil Mechanics
MODULE 2. Stress and Strength
MODULE 3. Compaction, Seepage and Consolidation of...
MODULE 4. Earth pressure, Slope Stability and Soil...
Keywords
LESSON 3. Index Properties of Soil
3.1 Various types of Soil Properties
The properties of soil are dependent on either individual grains of the soil (soil grain properties: such as mineralogical composition, size and shape of grains, specific gravity) or on the soil structure, mode of formation, stress history etc. (soil aggregate properties: such as Atterberg limits, permeability, relative density, unconfined compressive strength etc.).
The shape of soil grains is a very useful grain property incase of coarse grained soils. Soil grains can be Bulky, Flaky or plate-shaped, needle-shaped. For Bulky grains, all the dimensions of a grain are more or less same (sand or gravels). The bulky grains can be angular, sub-angular, rounded, sub-rounded. Figure 3.1 shows the various shapes of bulky particle. Soil having particles with high angularity posses higher shearing strength as compared to the soil having less amount of angular particles as particles with high angularity provide more resistance against displacement. Incase of flaky grains, thickness of the particles is vary less as compared to the other two dimensions of the grain (submicroscopic crystals of clay minerals). Incase of needle-shaped grain, one dimension is much longer than the other two dimensions (clay mineral like kaolinite).
3.1.1 Grain size distribution
Grain size distribution gives an idea about the percentage of various soil grains present in a dry soil sample. Grain size analysis can be carried out by sieve analysis incase of coarse-grained soil (such as sands, gravels) and hydrometer analysis incase of fine-grained soil (such as silt, clay). Incase of hydrometer analysis, Stokes’s law is used to determine the grain size distribution of the soil.
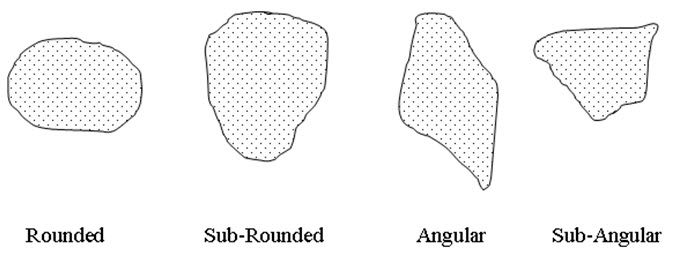
Figure 3.1. Shapes of Bulky Particles.
Based on the Sieve and Hydrometer analysis, grain-size distribution curves are plotted for different soils (as shown in Figure 3.2). In the graphs, X-axis represents the particle size (mm) (in log scale) and Y-axis represents percentage passing or percentage finer (in normal scale). In curve number 1, the percentage passing corresponding to the 0.5 mm particle size is 30%. This means that the 30% particle size is less that 0.5mm. Based on the shape and slope of the grain-size distribution curve, the type and gradation of the soil can be identified. A well-graded soil has a good representation of grain or particle sizes over a wide range and has smooth gradation (Curve No.1). Poorly-graded soil has either an excess or a deficiency of certain particle sizes (Curve No. 2). In the curve number 2, particle sizes in between 0.3 mm to 1.0 mm are excessively present (almost 80%). The grain size distribution curve of a poorly-graded soil has uniform gradation. In the Gap-graded soil, some of the particles sizes are missing (Curve No. 3). In the Figure 3.2, for curve number 3, particle sizes in between 0.3 mm to 1.0 mm are missing.
In the grain size distribution curve, D10 (the diameter corresponding to 10% percentage finer or passing) is called the effective size. From the particle distribution curve, two shape parameters the (Cu) and Coefficient of Curvature (Cc) are determined.
The Coefficient of Uniformity (Cu) and Coefficient of Curvature (Cc) are defined as:
\[{C_u}={{{D_{60}}} \over {{D_{10}}}}\] and \[{C_c}={{D_{30}^2} \over {{D_{10}} \times {D_{60}}}}\] (3.1)
where D60 and D30 are the grain diameter corresponding 60% and 30% finer, respectively. For well-graded soil, Cc value must be in between 1 to 3 and Cu value must be greater than 4 for gravels and greater than 6 for sands.
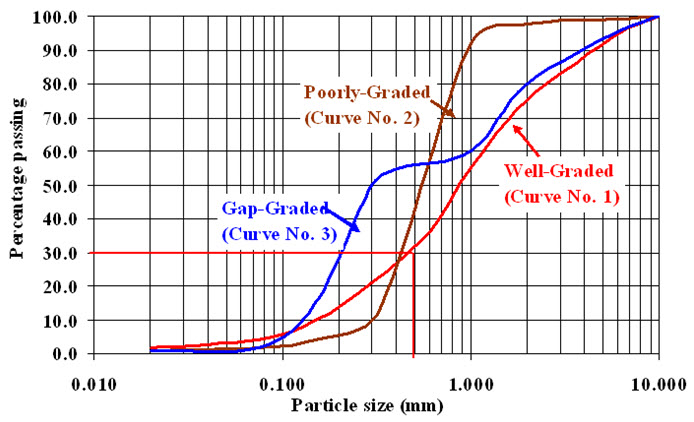
Figure 3.2. Grain-Size Distribute on Curves.
3.2 Atterberg limits
The physical properties of clays are significantly influenced by the amount of water present in the soil. Four states or stages are used to describe the consistency (the term used to describe whether soil is very soft, soft, medium, stiff or hard) of clayey soils depending upon the amount of water present in them, these are: Liquid State, Plastic State, Semi-Solid State and Solid State. The water contents at which soil changes its state from one to another is called consistency limits or Atterberg limits. If fine-grained soil is mixed with significant amount of water it is called Liquid State of the soil. In this state soil has practically no resistance to flow. If the amount of water is reduced from the soil then soil will change its state from liquid to plastic and from plastic to semi-solid and from semi-solid to solid. The water content at which soil changes it state from liquid to plastic is called Liquid Limit (wL), from plastic to semi-solid is called Plastic Limit (wP) and from semi-solid to solid is called Shrinkage Limit (wS). Figure 3.3 shows the variation of volume of soil with water content at different states or stages of the soil. As the water content decreases the volume of soil also decreases upto shrinkage limit and after that no volume change is observed due to the reduction of water content. This is due to the fact that upto shrinkage limit, the soil is fully saturated and beyond shrinkage limit the degree of saturation is 100%-0%. Thus, before shrinkage limit as the water content is reduced an equal amount of volume reduction takes place in the soil. In liquid state, in terms of consistency soil is liquid (does not have any shear strength), in plastic state, the state of soil varies from soft to stiff and in semi-solid and solid states it varies from stiff to very hard. In plastic stage, soil can be moulded to any shapes due to its plasticity. In semi-solid state, soil becomes brittle (does not have plasticity) and the brittleness further increases as it goes to solid state. The strength of the soil increases as the amount of water reduces from it.
Based on the various limits, some index properties of the soil are determined. Plasticity index (IP) of the soil is difference between liquid limit and plastic limit. Thus,
\[{I_P}={w_L} - {w_P}\] (3.2)
Plasticity index is used to indicate the degree of plasticity of the soil. If IP = 0, the soil is non-plastic (sand). For low plastic soil, IP <7, for medium plastic soil, IP value lies in between 7 to 17 and for high plastic soil, IP > 17 (Ranjan and Rao, 2000). When plastic limit is equal to or greater than liquid limit, Ip is considered as zero.
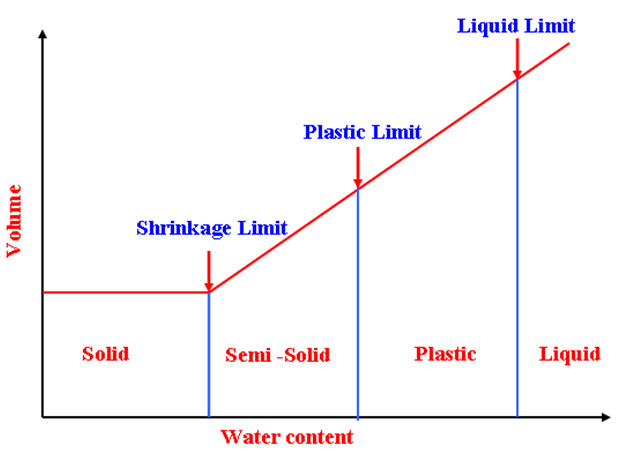
Figure 3.3. Atterberg limits
Consistency Index (IC) is the ratio of the difference between the liquid limit and natural water content of the soil to its plasticity index. Thus,
\[{I_C}={{{w_L} - {w_n}} \over {{I_P}}}\] (3.3)
If IC = 0, i.e wn = wL, If IC = 1, i.e wn = wP, if IC >1, the soil is in semi-solid or solid state and if IC <0, the soil is in liquid state.
Liquidity Index (IL) is the ratio of the difference between the natural water content and plastic limit of the soil to its plasticity index. Thus,
\[{I_L}={{{w_n} - {w_P}} \over {{I_P}}}\] (3.4)
From Eq. 3.3 and Eq. 3.4, one can say, IL = 1- IC. If IL = 0, i.e wn = wP, If IL = 1, i.e wn = wL , if IL >1, the soil is in liquid state and if IL <0, the soil is in semi-solid or solid state. In plastic state, both IL and IC values lie in between 0 to 1. These index properties are very important aggregate properties for clayey soil.
Unconfined Compressive Strength (qu) [load per unit area at which an unconfined cylindrical specimen of standard dimensions (as diameter 38mm and length 76mm) fails in simple compression] is a very important aggregate property of clay to describe its consistency. It is twice the undrained shear strength of clay. For very soft clay, qu < 25 kN/m2; for soft clay qu value lies in between 25 – 50 kN/m2; for medium clay qu value lies in between 50 – 100 kN/m2; for stiff clay qu value lies in between 100 – 200 kN/m2; for very stiff clay qu value lies in between 200 – 400 kN/m2; and for hard clay qu > 400 kN/m2 (Ranjan and Rao, 2000).
Relative Density (Dr or ID) is the most important aggregate property of coarse-grained soil to describe its degree of denseness or looseness. Relative density is defined as:
\[{I_D}={{{e_{\max }}-{e_{nat}}} \over {{e_{\max }}-{e_{\min }}}}\times 100%\] % (3.5)
where emax , emin and enat are the void ratio of the cohesionless soil in its loosest (maximum void ratio), densest (minimum void ratio) and natural (natural void ratio) state, respectively. In terms of unit weight of the soil the Eq.(3.5) can be written as:
\[{I_D}=\left({{{{\gamma _{d\max }}}\over{{\gamma _d}}}}\right)\left({{{{\gamma _d}-{\gamma _{d\min}}}\over{{\gamma_{d\max}}-{\gamma _{d\min }}}}}\right) \times 100\% \] % (3.6)
where gdmin, gdmax and gd are the dry unit weight of cohesionless soil in its in its loosest (minimum dry unit weight), densest (maximum unit weight) and natural (dry unit weight at natural condition) state, respectively. For very loose granular soil ID < 15%; for loose granular soil ID lies in between 15 to 35%; for medium granular soil ID lies in between 35 to 65%; for dense granular soil ID lies in between 65 to 85%; for very dense granular soil ID > 85% (Ranjan and Rao, 2000).
References
Ranjan, G. and Rao, A.S.R. (2000). Basic and Applied Soil Mechanics. New Age International Publisher, New Delhi, India
Suggested Readings
Ranjan, G. and Rao, A.S.R. (2000). Basic and Applied Soil Mechanics. New Age International Publisher, New Delhi, India.
Arora, K.R. (2003) Soil Mechanics and Foundation Engineering. Standard Publishers Distributors, New Delhi, India.
Murthy V.N.S (1996) A Text Book of Soil Mechanics and Foundation Engineering, UBS Publishers’ Distributors Ltd. New Delhi, India.
Last modified: Monday, 23 September 2013, 6:58 AM