Site pages
Current course
Participants
General
Module 1: Watershed Management – Problems and Pros...
Module 2: Land Capability and Watershed Based Land...
Module 3: Watershed Characteristics: Physical and ...
Module 4: Hydrologic Data for Watershed Planning
Module 5: Watershed Delineation and Prioritization
Module 6: Water Yield Assessment and Measurement
Module 7: Hydrologic and Hydraulic Design of Water...
Module 8: Soil Erosion and its Control Measures
Module 9: Sediment Yield Estimation/Measurement fr...
Module 10: Rainwater Conservation Technologies and...
Module 11: Water Budgeting in a Watershed
Module 12: Effect of Cropping System, Land Managem...
Module 13: People’s Participation in Watershed Man...
Module 14: Monitoring & Evaluation of Watershe...
Module 15: Planning and Formulation of Project Pro...
Module 16: Optimal Land Use Models
Keywords
Lesson 30 Economics of Watershed Projects
30.1 Economic Evaluation of Watershed Projects
Economic evaluation of watershed projects is essential to determine their consequential effects on social welfare needs and environmental enhancements. Watershed projects also generate productive, protective, social and employment generation benefits. A watershed project is considered economically feasible if the total benefits that result from the project exceed those which would accrue without the project by an amount in excess of the project cost. Economic feasibility is contingent on technical feasibility because a project incapable of producing the desired output is not going to produce the benefit needed for its justification. The test of social feasibility is equally important components of overall economic evaluation of the project. Social feasibility of watershed projects is determined by assessing the change in daily lives of the beneficiaries and evaluating the willingness of the stakeholders. Project evaluation requires a comparison between the events predicted to occur if the project is built and those predicted to occur if the project is not built. Cost and benefits of actual events are considered for economic evaluation.
30.1.1 Benefits
Benefits of watershed projects vary from many kinds of effects, a systematic procedure is required to make sure that each effect is considered and evaluated. A variety of terminologies have been used by planners and economists to describe individual project consequences. Measurement of cost is relatively easier than the complex benefit consequences resulting from a watershed project. Broadly, the benefits are classified into tangible and intangible benefits.
1. Tangible benefits results from the consequences to private parties, which can be assigned a monetary value. The benefits obtained from project-produced goods and services denote primary benefits and these could be of different kinds (direct, indirect, land-enhancement, protective etc.) Direct benefits accrue by putting project output to its intended use. They may consist of increase in farm income resulting from application of irrigation water, reduction in physical damage as a result of flood protection and sand casting on fertile lands etc. Indirect benefits result as individuals realize the economic consequence of technological external effects. The effects may result either from the production of project output or from its use by others. For example, output intended for one purpose (storage of harvested rainwater for irrigation) may also provide other beneficial effects (fish production). Protection of uplands from irreversible losses through erosion may benefit community of extra revenue and fodder from protected uplands. Land enhancement benefits result, where more productive land uses is made possible by the watershed project and are distinguished from direct benefits to the land use, which would prevail without the project.
Benefits that may accrue from watershed projects are,
Protection to the eroding uplands
Protection to the downstream fertile lands from silt flow, floods and sand casting.
Land development in the command area.
Flood moderation and drought alleviation.
Irrigation in kharif and rabi seasons.
Increased biomass production from erstwhile degraded or wasted common lands.
Improved environment and communication, etc.
2. Intangible benefits describe consequences, which cannot be assigned a monetary value but should be considered while evaluating a project. Examples of such benefits of water harvesting structures may consist of environmental restoration, ecological diversity etc.
30.1.2 Costs
Costs of the project generally include cost of construction, operation and maintenance of activities associated with watershed projects like cost of storage (dam, spillway, pond, etc.), cost of soil conservation structures (contour bunding, terraces, half moon terraces), cost of water distribution system, etc.
30.1.3 Mathematics of Economic Analysis
Economic analysis consists of following steps:
Estimate or predict physical consequences (i.e. benefits and costs) resulting from each alternative (i.e. watershed activities) including that of doing nothing.
Assign a monetary value on each physical consequences based on market price.
Select a discount rate to convert the prediction time of monetary values into an equivalent single number.
Select an appropriate time horizon of the project.
Compare the alternatives for selecting a feasible project and in case of post project evaluation compare the cost and benefits with the bench mark data.
30.2 Concept of Time and Money
A rupee in hand is more valuable than a rupee to be received a year from now. The process of finding the present worth of future income is called discounting. It is the present value of future payments discounted at some rate, called discount rate. The interest rate assumed for discounting is the discount rate. The discount rate is generally the same as prevailing interest rate in the market. The interest rate looks backwards from the future to the present.
30.2.1 Discounting Factors
1) Single Payment Factors
a) Single Payment Compound Amount Factor (SPCAF):
This indicates the number of rupees, which have accumulated after N years for every rupee initially invested at a rate of return of i percent (Fig. 30.1). For P as a present and F as a future amount, the formula is given as:
![]()
Where,
(1+ i)N is called discount factor for single payment compound amount and abbreviated as (F/P, i%, N).
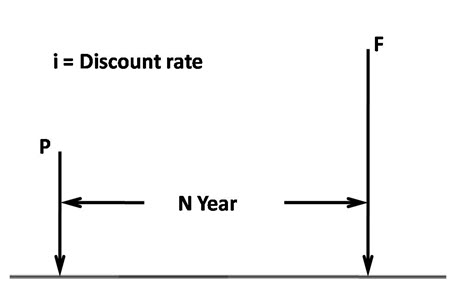
Fig. 30.1. Single-payment factors (a) Single-payment compound amount factor = F/P, (b) Single payment present worth factor = P/F.
(Source: Samra et. al.,2002)
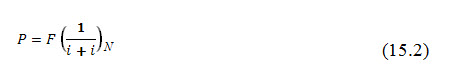
b) Single Payment Present Worth Factor (SPPWF):
This indicates the number of rupees (P) one must initially invest at i % discounting rate to have F rupee after N years. It is inverse of SPCAF;
Where,
 is discount factor for single payment present worth and abbreviated as (P/F, i %, N).
2) Uniform Annual Series Factors
a) Sinking Fund Factor
This indicates the number of rupees one must invest in uniform amounts at i percent interest rate at the end of each of N years to accumulate one rupee. If A is equal amount at the end of each year and F is accumulated amount, then
Where,  is the sinking fund factor abbreviated as (A/F, %, N)
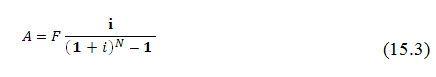
b) Capital Recovery Factor (CRF)
This indicates the number of rupees one can withdraw in equal amounts at the end of each of N years if one rupee is initially deposited at i percent interest. Hence,
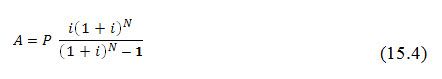
Where,  is the capital factor and abbreviated as (A/F, %, N).
c) Uniform Series Compound Amount Factor (USCAF)
This indicates the number of rupees, which will accumulate if one rupee is invested at i percent rate at the end of each of N years. It is inverse of sinking fund factor.
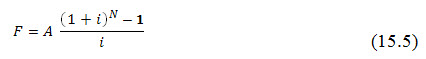
Where,  is the USCAF and abbreviated as (F/A, %, N)
d) Uniform Series Present Worth Factor (USPWF)
This indicates the number of rupees one must initially invest at i percent rate to withdraw one rupee at the end of each of N years. This is the inverse of the capital recovery factor.
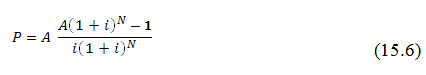
Where, 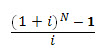 is the discount factor (P/A, %, N) for USPWF
30.3 Cash Flow
Cash flow is the movement of money into or out of a business, project, or financial product. It is usually measured during a specified, finite period of time. Measurement of cash flow can be used for calculating other parameters that give information on a project's value and situation. Cash flow can be used, for example, for calculating parameters:
To determine a project's rate of return or value. The time of cash flows into and out of projects are used as inputs in financial models such as internal rate of return and net present value.
Cash flow can be used to evaluate the 'quality' of income generated by accrual accounting. When net income is composed of large non-cash items it is considered low quality.
To evaluate the risks within a financial product, e.g., matching cash requirements, evaluating default risk, re-investment requirements, etc.
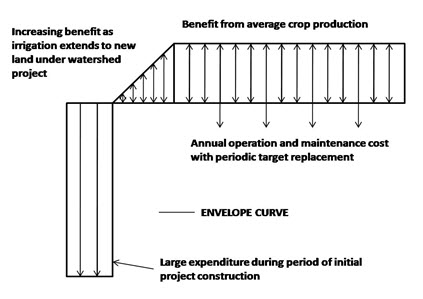
Fig. 30.2. Cash flow diagram for hypothetical irrigation project.
(Source: Samra et. al. , 2002)
Cash flow can be diagrammatically represented in the form of graphical presentation of each monetary value (costs and benefits) on vertical axis and time on horizontal axis (Fig. 30.2). Receipts or benefits are represented by arrows pointing upwards, while costs are represented by arrow pointing downwards. The length of the arrow is made proportional to the cost or benefit. Cash flow diagram provides a conceptualized picture of project value at different stages to help in carrying out benefit-cost analysis. Annual benefits and cost will not in fact be constant every year but vary around average values in an almost random fashion with crop production and other operation and maintenance needs.
30.4 Discounting Techniques
The procedure in which discounting factors may be systematically applied to compare alternatives is a discounting technique. There are three discounting techniques: (i) present worth method (ii) benefits-cost ratio method, and (iii) rate of return method. Each method, if used correctly, leads to the same evaluation of the relative merit. However, each has advantages and disadvantages.
1) Present Worth Method
The present worth (PW) of the net benefits of the project is the difference between the discounted value of all the benefits and cost of the project over its life.
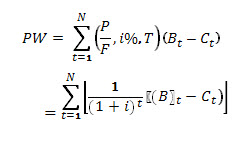
Where Ct is the cost, and Bt is the benefit in year (t), N is the period of analysis in year and i is discount rate.
Following rules are applied to make correct choices:
Figure all present worth to the same time base.
Determine all present worth by using the same discount rate.
Accept the project when PW > 0, otherwise reject. Higher the PW, better is the project.
Choose the alternative with greatest present worth in a set of mutually exclusive alternatives.
If benefits cannot be qualified but are approximately equal, or the budget is limited, choose the alternative having least cost.
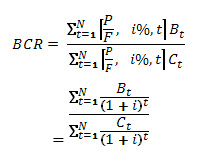
2) Benefit-Cost Ratio Method
The befit-cost ratio (BCR) is the present worth of benefits (PWb) divided by the present worth of cost (PWc)
The following rules are followed:
Figure all present worth to the same time base.
Project is worth considering if BCR > 1, otherwise reject it. If set of mutually exclusive alternatives (or projects) are involved for comparison, proceed to next rule.
Rank the alternatives in the set of mutually exclusive alternatives in order of increasing cost. Choose the more costly alternative if the incremental BCR exceeds unity, otherwise, choose the less costly alternative.
Determine all present worth by using the same discount rate.
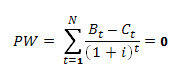
3) Rate of Return Method
The rate of return (ROR), also called internal rate of return (IRR), is the discount rate, which makes the net present value or present worth (PW) of net benefits equal to zero. It represents the average earning power of the money in the project over its life. It is found by trial and error in successive approximation to find the ROR, which will make the sum zero.
Choose a discount rate and compute PW of net benefits. If this sum (i.e. PW) is zero, the chosen discount rate will be the ROR. If the PW is positive, repeat the exercise with a higher discount rate. If it is negative, find out a lower discount rate, until the PW value is reached nearest to zero. When the value changes from positive to negative (or vice versa), interpolate to arrive at the estimated ROR.
Project is considered economically worthy, when ROR is higher than the interest rate payable on invested money or any minimum acceptable value. If set of mutually exclusive alternatives are involved, rank them in order of increasing cost. Choose the more costly project if the incremental ROR exceeds the minimum acceptable interest rate, otherwise choose the less costly alternative.
30.5 Costs-Benefit Analysis
Cost–benefit analysis (CBA), sometimes called benefit–cost analysis (BCA), is a systematic process for calculating and comparing benefits and costs of a project, decision or government policy (hereafter, "project"). CBA has two purposes:
To determine if it is a sound investment/decision (justification/feasibility).
To provide a basis for comparing projects. It involves comparing the total expected cost of each option against the total expected benefits, to see whether the benefits outweigh the costs, and by how much.
CBA is related to, but distinct from cost-effectiveness analysis. In CBA, benefits and costs are expressed in monetary terms, and are adjusted for the time value of money, so that all flows of benefits and flows of project costs over time (which tend to occur at different points in time) are expressed on a common basis in terms of their "net present value." Closely related, but slightly different, formal techniques include cost-effectiveness analysis, cost–utility analysis, economic impact analysis, fiscal impact analysis and social return on investment (SROI) analysis.
Cost–benefit analysis is often used by governments and other organizations, such as private sector businesses, to evaluate the desirability of a given policy. It is an analysis of the expected balance of benefits and costs, including an account of foregone alternatives and the status quo. CBA helps predict whether the benefits of a policy outweigh its costs, and by how much relative to other alternatives (i.e. one can rank alternate policies in terms of the cost-benefit ratio). Generally, accurate cost-benefit analysis identifies choices that increase welfare from a utilitarian perspective. Assuming an accurate CBA, changing the status quo by implementing the alternative with the lowest cost-benefit ratio can improve Pareto efficiency. An analyst using CBA should recognize that perfect evaluation of all present and future costs and benefits is difficult, and while CBA can offer a well-educated estimate of the best alternative, perfection in terms of economic efficiency and social welfare are not guaranteed.
The following is a list of steps that comprise a generic cost-benefit analysis.
List alternative projects/programs.
List stakeholders.
Select measurement(s) and measure all cost/benefit elements.
Predict outcome of cost and benefits over relevant time period.
Convert all costs and benefits into a common currency.
Apply discount rate.
Calculate net present value of project options.
Perform sensitivity analysis.
Adopt recommended choice.
30.5.1 Principles of Cost Benefit Analysis
One of the problems of CBA is that the computation of many components of benefits and costs is intuitively obvious but that there are others for which intuition fails to suggest methods of measurement. Therefore some basic principles are needed as a guide.
1. There must be a Common Unit of Measurement
In order to reach a conclusion as to the desirability of a project, all aspects of the project, positive and negative must be expressed in terms of a common unit; i.e., there must be a "bottom line." The most convenient common unit is money. This means that all benefits and costs of a project should be measured in terms of their equivalent money value. A program may provide benefits which are not directly expressed in terms of rupees but there is some amount of money the recipients of the benefits would consider just as good as the project's benefits.
2. CBA Valuations should Represent Consumers or Producers Valuations as revealed by their actual behavior
The valuation of benefits and costs should reflect preferences revealed by choices which have been made. For example, improvements in transportation frequently involve saving time. The question is how to measure the money value of that time saved. The value should not be merely what transportation planners think time should be worth or even what people say their time is worth. The value of time should be that which the public reveals their time is worth through choices involving tradeoffs between time and money.
3. Benefits are Usually Measured by Market Choices
When consumers make purchases at market prices they reveal that the things they buy are at least as beneficial to them as the money they relinquish. Consumers will increase their consumption of any commodity up to the point, where the benefit of an additional unit (marginal benefit) is equal to the marginal cost to them of that unit, the market price. Therefore for any consumer buying some of a commodity, the marginal benefit is equal to the market price. The marginal benefit will decline with the amount consumed just as the market price has to decline to get consumers to consume a greater quantity of the commodity. The relationship between the market price and the quantity consumed is called the demand schedule. Thus the demand schedule provides the information about marginal benefit that is needed to place a money value on an increase in consumption.
4. Gross Benefits of an Increase in Consumption is an Area under the Demand Curve
The increase in benefits resulting from an increase in consumption is the sum of the marginal benefit times each incremental increase in consumption. As the incremental increases considered are taken as smaller and smaller the sum goes to the area under the marginal benefit curve. But the marginal benefit curve is the same as the demand curve so the increase in benefits is the area under the demand curve.
5. Decision Criteria for Projects
If the discounted present value of the benefits exceeds the discounted present value of the costs then the project is worthwhile. This is equivalent to the condition that the net benefit must be positive. Another equivalent condition is that the ratio of the present value of the benefits to the present value of the costs must be greater than one. If there are more than one mutually exclusive project that have positive net present value then there has to be further analysis. From the set of mutually exclusive projects the one that should be selected is the one with the highest net present value.
Example 1: How much will be the worth of irrigation benefit of Rs. 50,000.00 and Rs. 90,000.00 of net benefits resulting from water harvesting project 5 and 20 years after the start of construction, respectively, at interest rate of 12%.
Solution:
Present worth of Rs. 50,000 after 5 years
P = 50,000.00 (P/F, 12.5%, 5)
From the interest table for i =12%, discount factor for N = 5 = 0.5674
Therefore, P = 50,000.00 X 0.5674= Rs. 28370.00
Present worth of Rs. 90,000 after 20 years
P = 90,000.00 (P/F, 12%, 20)
From the interest table for i =12%, discount factor for N = 20 = 0.1037
Therefore, P = 90,000.00 X 0.1037 = Rs. 9333.00
Example 2: How much will be the worth of irrigation benefit of Rs. 5000.00 in 15 years at the interest rate of 12%?
Solution:
Present worth (P) = Rs.5000.00, N = 15 years and i = 12%
Therefore, future worth (F) after 15 years will be F = 5000.00 (F/P, 12%, 15)
= 5000.00 X 5.4736 = Rs. 27,368.00 (F/P value obtained from table)
Discount factor, F/P can also be calculated (F/P, 12%, 15) = (1+ 0.12)15 = 5.4736
Keywords: Watershed Projects, Economic Evaluation, Cost Benefit Analysis, Discounting Techniques
References
Samra, J. S., Sharda, V. N., and Sikka, A. K. (2002). Water Harvesting and Recycling Indian Experiences. Central Soil and Water Conservation Research and Training Institute, Dehra Dun, India
Suggested Readings
Tolley, G. S., & RIGGS, F. E. (1961). Economics of Watershed Planning. Economics of Watershed Planning.
Thurston, H. W., Heberling, M. T., & Schrecongost, A. (Eds.). (2010). Environmental Economics for Watershed Restoration. CRC Press.