Module 7. Role of computers in optimization
Lesson 18
ROLE OF COMPUTERS IN OPTIMIZATION
18.1 Introduction
This lesson will discuss the concept of Operations Research (OR), computer oriented algorithmic approaches, queuing systems and waiting models, and applications of OR in dairy industry. The topics discussed in this lesson will be useful to the students for understanding the importance of OR in decisions making and solving the complex problems.
The formal beginning of operational research as discipline was initiated in England during World War II when a team of British scientists set out to make decisions regarding the best utilization of war material. In the decades after the war, the techniques began to be applied more widely to problems in business, industry and society to improve efficiency and productivity. Since that time, operational research has expanded into a field widely used in industries ranging from petrochemicals to airlines, finance, logistics, dairy plants and government, moving to a focus on the development of mathematical models that can be used to analyse and optimize complex systems. Today, OR is a dominant and indispensable decision making tool and has become an area of active academic and industrial research. This subject is also known as Industrial engineering.
Operations research or Operational research (also referred to as decision science or management science) is an interdisciplinary mathematical science that encompasses a wide range of problem-solving techniques and methods applied to improve decision-making and efficiency. Some of the tools used by operations researchers are statistics, graph theory, probability theory, decision science, queuing theory, linear programming, mathematical optimization, simulation, and other stochastic-process models. Almost all of these techniques involve the construction of mathematical models that attempt to describe the system. Though, the solution of mathematical modelling provides a basis for making decision, intangible factors such as human behaviour which cannot be quantified, must be taken into account before reaching to final decision. Because of the computational and statistical/ mathematical nature of most of these fields, OR also has strong ties to computer science and analytics. Researchers try to determine the most appropriate techniques suitable for a given system, goals for improvement, and constraints on time and computing power.
The major sub-disciplines in modern operational research are:
- Computing and information
technologies
- Environment, energy, and
natural resources
- Financial and marketing
Engineering
- Manufacturing, service
sciences, and supply chain management
- Policy modelling and public
sector work
- Revenue management
- Simulation
- Stochastic models
- Transportation
18.2 Operations Research
Operations research is a discipline that deals with the application of advanced analytical methods and information technology to make better decisions. The complex problem is decomposed into basic components and solved with mathematical analysis by employing analytical methods from interdisciplinary mathematical sciences, such as multi-criteria decision analysis, network analysis, queuing theory, statistical analysis, optimization, conjoint analysis, neural networks, etc., to arrive at optimal or near-optimal solutions to complex decision-making problems. Psychology and management sciences also play important role in final decision making process. The goal is to provide rational bases for decision making to improve the system performance by understanding the complexities involved in the system. Non managerial level personals are also benefitted from the improved and streamed decision making process. OR techniques applied for solving problems can be broadly classified into following three basic groups of methods. Within each of the three basic groups many probabilistic methods provide the ability to assess risk and uncertainty factors.
- Optimization methods: The goal is to enable the decision maker to
search best choice based on certain criteria’s from the available various
possible choices in an efficient and effective manner.
- Simulation method: These methods are used to observe the real
systems. It is used to estimate the measures of performance of modelled
systems and provides the ability to conduct sensitivity analysis to search
for improvements.
- Data analysis method: The goal is to aid the decision maker in finding
actual patterns, forecasting, and inter connections in the data set.
Major steps involved in solving a problems using OR tools are:
I. Problem Definition
II. Construction of mathematical model
III. Solution of model
IV. Validation of model
V. Implementation of the solution
Some of the benefits offered by OR are:
- Decrease cost or investment
- Increase revenue or return on
investment
- Manage and reduce risks
- Improve quality of services
- Increase throughput while
decreasing delays
- Improve utilization from
limited resources
18.3 Role of Computers in Optimization
There is no single technique that can solve all mathematical models in OR. The type and complexity of mathematical models used for solution depends on the nature of problem. Sometimes models are simple and straight forward involving few steps to solve the problem. But in practical situation, the models are complex and involve lot of computations. A large number of OR tools are available to deal with different kind of problems and complexities, a few commonly used techniques are:
· Linear programming techniques are used to find optimal solutions for models with strict linear objectives and constraints functions from the limited resources available.
· Network programming techniques are used where the problem can be modelled as a network. These techniques are used to find shortest path, project scheduling, computing critical path, PERT/CPM/CPS, etc.
· Queuing and simulation techniques are used to study the behaviour of real-time systems. These techniques measure the performance of systems such as average waiting time in queues, average waiting time for services and utilization of services.
The distinguish characteristics of most OR techniques is that solutions are not generally obtained in closed form just like a one or two line formula instead these are determined in several step by using algorithms. An algorithm provides fixed computational rules that are applied repetitively to the problem with each repetition (called iteration) moving the solution closer to optimum. Because the computations associated with each iteration are typically tedious and voluminous, it is imperative that these algorithms are executed on the computers. Moreover, some mathematical models are so complex such as simulation models that it is just impossible to solve them manually. In these situations, it has become necessary to convert the algorithms into computer programs to find solutions in efficient and convenient way. Therefore, use of a digital computer has become an integral part of the OR approach for decision making. The computers are required due to the complexity of the model, volume of data required and the computations to be made.
Specialized software packages have been developed by experts for solving general OR problems as well particular problems related to specific domain. General purpose software such as SAS, MATLAB, MATHMATICA, EXCEL, etc., have module for solving OR problems. One of such computer software for academic purpose is TORA and can also be used for commercial and industrial real time applications. This is Window based software distributed along with operation research book (Hamdy A. Taha). TORA offers solutions for almost all mathematical models used in OR for problem solving such as matrix inversion, solutions of simultaneous equations, linear programming, transportation models, network models, queuing models, project planning with CPM and PERT, integer programming, non-linear programming, etc. It is easy to operate and contains self explanatory instructions and menus. It can be operated in tutorial or automated mode. Tutorial mode is particularly useful for beginners.
18.4 Queuing Systems and Waiting Models
Waiting for services is a part of our life since the servers/ facilities providing the services are limited and in flow of persons in search of services are more. Waiting in lines to obtain services is most difficult and it seems like wastage of our precious time. We wait to eat in restaurants, to withdraw/ deposit amount in banks/ ATM counter etc. Similarly lactating cows wait for milking at milking parlour. Jobs wait for processing by machines, congestion in computer networks, etc. In general a queue is formed when either units requiring services (commonly referred as customers) wait for service or the service facilities, stand idle and wait for customers. Unfortunately, we cannot eliminate waiting without increasing service facilities which, incurs extra ordinary cost on the system. We can only try to reduce the adverse impact to tolerable levels. Queuing theory has applications in diverse filed such as computing, telecommunications, dairy industry, designing of factories, shops, milk collection centres, hospitals etc.
Mathematical study of waiting lines or queues is called queuing theory. It enables mathematical analysis of several related processes of queue such as arriving, waiting, and being served at the front of the queue. The theory, deals with quantifying the phenomenon of waiting in lines using representative measures of performance such as average queue length, average waiting time in queue, and average facility utilization. Various analytical models are used to study queuing system which, help the managers to design cost effective service facilities. The objective of queuing analysis is to evaluate the service and the cost of a facility so as to maximize its usefulness. This result in minimizing the total cost associated with the idle time to facilities or services versus the waiting time costs of employees or customers.
18.4.1 Types of queuing systems
As the number of queues and service facilities, there are four variations in the queuing system as given below:
· Single queue – Single server
· Single queue – Multiple servers (either in parallel or series)
· Multiple queues – Single server
· Multiple queues – Multiple servers
18.4.2 Elements of a queuing system
The queuing process mainly revolves around the customers requiring services and server which provide one or more service facilities. Customers are generated from a source which may be from finite or infinite population. On the arrival at the facility, they can start service immediately or wait in a queue if the facility is busy. When a facility completes a service, it automatically takes next customer waiting in queue. If there is no customer in the queue (i.e. queue is empty), the facility becomes idle until a new customer arrives.
From analysis point of view, arrival process is represented by the interarrival time between successive customers, and the service is described by the service time per customer. Generally the interarrival and service times can be probabilistic as number of calls in telephone exchange or deterministic as the arrival of cows for milking in a milk parlour.
Queue size plays a role in analysing the queues. It may have finite size or infinite as in mailing order facilities. Queue discipline is an important factor in the analysis of queuing models. It represents the order in which customers are selected from queue. The most common disciplines are First-Come-First-Served (FCFS), Last-Come-First-Served (LCFS) and Service in Random Order (SIRO). Customers may also be selected from the queue based on some order of priority.
The queuing behavior of customers plays a role in waiting line analysis. Customers may jockey from one queue to another in the hope of reducing their waiting time. They may also balk from joining the queue because of long waiting time or they may renege from a queue because they have been waiting too long.
Queuing system takes into account of the whole situation considering from arrival of the customer into the system till exit of the customer. The time in system is generally taken to be the queuing plus service time. The variations in the elements of a queuing situation give rise to a variety of queuing models.
18.4.3 Interarrival and service time distributions
In most situations the arrival of customers occurs in a totally random fashion. Randomness means that the occurrence of an event (e.g., arrival of customer or completion of service is not influenced by the length of time that has elapsed since the occurrence of the last event. The random interarrival and service time are approximated by one of the well known mathematical distributions such as:
· Poisson distribution: The
density function of Poisson probability distribution is given by:
![]()
· Exponential distribution: The density function of exponential distribution is given by:
![]()
Where,
|
n = |
Number of customers in the system (waiting and in service) |
|
Pn (t) = |
Transient state probability that n calling units are in the queuing system at time t |
|
Pn = |
Steady state probability of having n units in the system |
|
λ = |
Average (expected) customer arrival rate or average number of arrivals per unit of time in the queuing system |
|
μ = |
Average (expected) service rate or average number of customers served per unit time at the place of service |
|
e = |
Constant, equal to 2.71828 |
Note: Above functions can also used for service time, in that case λ is replaced with m.
18.4.4 Queuing models
A queuing model is used to approximate a real queuing situation or system, so the queuing behavior can be analyzed mathematically. Queuing models allow a number of useful steady state performance measures to be determined, including:
- the
average number in the queue, or the system,
- the
average time spent in the queue, or the system,
- the statistical
distribution of those numbers or times,
- the
probability the queue is full, or empty, and
- the
probability of finding the system in a particular state.
Generally queuing model can be specified by the symbolic representation (a|b|c) : (d|e|f) using Kendall's notation. The meaning of symbols used in representing queuing model and the standard notations used in place of these symbols are described in table 18.1 given below:
Table 18.1 Symbols used queuing model and their standard notations
|
Meaning of symbols |
Standard notations used in place of symbols |
|
|
a : |
Arrival distribution (or inter-arrival) |
· M for a Markovian (poisson, exponential) distribution · Ek for an Erlang distribution with k phases · D for constant (or deterministic) time · GI for general distribution of interarrival time · G for general distribution of service time |
|
b : |
Service time (departure) distribution |
|
|
c : |
Number of parallel servers or service stations |
Finite or
infinite (any positive number 1, 2, 3, …, or |
|
d : |
Queue discipline |
FCFS, LCFS, SIRO, GD (general discipline i.e. any type of discipline) |
|
e |
Capacity of the system |
Finite or
infinite (any positive number 1, 2, 3, …, or |
|
f : |
Size of the calling source |
Finite or
infinite (any positive number 1, 2, 3, …, or |
Examples:
i. (M|M|1): (FCFS|∞|∞) indicates a queuing system when the inter-arrival times and service times are exponentially distributed having one server in the system with first come first served discipline and the number of customers allowed in the system i.e. capacity of the system can be infinite as well as size of the calling source.
ii. (M|D|5): (GD|20|∞) indicates a queuing system where the inter-arrival times is poisson (or Exponential) distribution, constant service time, and 5 parallel server in the system. Queue discipline is GD (i.e. general discipline), and there is a limit of 20 customers on the entire system. The size of the source from which customers arrive is infinite.
18.5 Applications of OR in Dairy Industry
A large number of mathematical models are used in OR to solve problems related to optimization, simulation, network programming, forecasting and data analysis. Some prominent techniques such as linear programming, queuing theory, simulation, etc., are used extensively in dairy industry for efficient management of dairy operations. Following are few common applications of these techniques in dairy industry:
18.5.1 Linear programming applications
Linear programming technique is used to find the optimum solutions for given number of constraints and limited resources. This technique has numerous applications in dairy industry as explained below with real time examples.
A. A dairy plant is interested in developing a least cost ice-cream mix. The ingredients to be used for making ice-cream are cow milk, skim milk powder (SMP) roller, white butter, sugar and gelatin. With these ingredients an ice-cream mix of 100 kgs. may be prepared having a minimum of 10 per cent fat and 10.5 per cent SNF. Similarly the minimum quantity of sugar required is 15 kgs. And that of gelatin should be exactly equal to 0.5 kg. The following table gives the fat and SNF content in cow milk, skim milk powder and white butter as well as net cost per unit of all the ingredients.
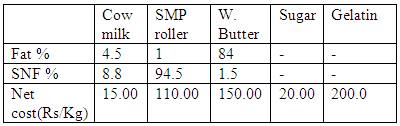
Formulate a linear programming problem to minimize the cost of ice-cream mix. Also develop the matrix of coefficients for solving LP problem using L.P. software package.
B. A farm manager is interested in developing a least cost concentrate mixture for their milch stock. The ingredients to be used for formulation of concentrate mixture are ground nut cake (GNC), mustard cake (MC), wheat bran (WB), rice bran (RB), maize (MZ), barley (BL), mineral mixture (MM), salt (SL). With these ingredients a concentrate mixture of 100 kgs. with minimum 70% TDN and 14% DCP is to be prepared which should contain a maximum of 25 kgs. of GNC, 10 kgs. MC, 15 kgs. WB, and 10 kgs RB. However the minimum requirement of maize and barley in the concentrate mixture is 30 kgs each. The quantity of mineral mixture and salt should be exactly equal to 2 kgs and 1 kg respectively. The following table gives the TDN and DCP composition of various feed ingredients as well as net cost per unit for all the ingredients.
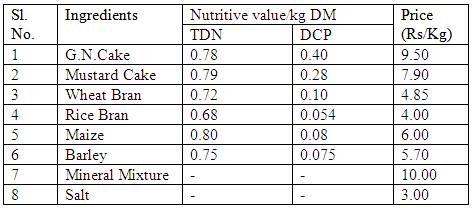
Formulate a linear programming problem to minimize the cost of concentrate mixture. Also prepare a matrix to solve this L.P. problem through LP software package.
18.5.2 Queuing theory applications
Queuing theory has numerous applications in dairy industry for the situations where waiting time is to be reduced for improving the efficiency of system A few real time applications of queuing theory in dairy industry are:
A. The author S. Pimpicki, through his research work has demonstrated the application of queuing theory for reducing the vehicle waiting time for raw milk collection by a dairy. A method is presented for defining and solving practical problems of delivery of raw materials to food processing factories, based on the queuing theory. The method is demonstrated by the example of raw milk collection by a dairy (optimization of number of milk reception points so as to reduce vehicle waiting time while at the same time achieving max. utilization of reception capacity). A monogram is given for calculating average queuing time as a function of number of reception points and movement rate. The hypothesis that vehicle arrival follows a Poisson distribution was verified.
{Source: Pimpicki, S., “Application of queueing theory to organization of supply of raw agricultural materials illustrated by a dairy industry example”, Zeszyty Naukowe Akademii Rolniczo-Technicznej w Olsztynie No. 148 (Ekonomika 2) , 1975, 3-12.}
B. The author Piotr Cegiełła et. al., in an another study have beautifully shown the applications of queuing theory in dairy industry. This article deals with an example of the real problem of the Vehicle Collection optimization, which enables the plants to carry on their production. The problem has been solved in Poland in the delivery of milk to dairy plants. The milk collection optimization, however, is not a simple inversion of dairy product deliveries in town. Therefore we have the Vehicle Collection Problem (VCP) as an extension of the Vehicle Scheduling Problem (VSP). Next we present the idea of the Multicolmilk procedure, which satisfied several technical and organizational constraints of the milk collection process. To solve the VCP we have developed a modular Collection Optimization System (Colos). The basic component of the Colos is an optimization module based on the Multicolmilk procedure. The last part of the article contains implementation results in the dairy plants of Konin, Gniezno, Zielona Góra, and Cz¸estochowa, together with the presentation of difficulties which have cropped up in the course of preparation and implementation processes.
{Source: Piotr Cegiełła, Wacław Szymanowski, and Jerzy Prokuratorski, “Colos: A collection optimization system as an application of the vehicle scheduling problem”, European Journal of Operational Research, Volume 27, Issue 1, 1986, Pages 82–90}
C. Another important application is how to reduce the waiting
of milking for lactating cows standing in queue for milking. Students can think
and try to solve this problem.