Module 5. Test of significance
Lesson 20
F- TEST AND ITS APPLICATIONS
20.1 Introduction
A large number of research experiments are conducted to examine the effect of various factors on the production and quality attributes of milk and milk products. F-test is used either for testing the hypothesis about the equality of two population variances or the equality of two or more population means. The equality of two population means was dealt with t-test. Besides a t-test, we can also apply F-test for testing equality of two population means. Sir Ronald A. Fisher defined a statistic Z which is based upon ratio of two sample variances. In this lesson we will consider the distribution of ratio of two sample variances which was worked out by G.W. Snedecor.
20.2 F-Statistic
Let X1i (i=1,2,…,n1)
be a random sample of size n1from the first population with variance
σ12
and X2j (j=1,2,…,n2) be another independent random sample
of size n2 from the second normal population with variance σ22.
The F- statistic is defined as the ratio of estimates of two variances as given
below:
![]()
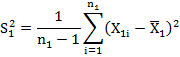
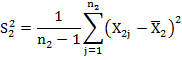
where, S12 > S22 and are unbiased estimates of population variances which are given by:
It follows Snedecor’s F- distribution with (n1-1, n2-1)
d.f. i.e., F~F (n1
– 1, n2 – 1).
Further,
if X is a χ2-variate with n1 d.f. and Y is another independent χ2-variate
with n2 d.f., then F-statistic is defined
as: ![]() i.e.
F-statistic is the ratio of two independent Chi-square variates divided by
their respective degrees of freedom. This statistic follows G.W. Snedecor F distribution
with (n1,n2) d.f.
The sampling distribution of F-statistic does not involve any population
parameter and depends only on the degrees of freedom n1and n2.
i.e.
F-statistic is the ratio of two independent Chi-square variates divided by
their respective degrees of freedom. This statistic follows G.W. Snedecor F distribution
with (n1,n2) d.f.
The sampling distribution of F-statistic does not involve any population
parameter and depends only on the degrees of freedom n1and n2.
20.3 Application of F- Distribution
F-distribution has a number of applications in statistics, some of which are given below
a) F-test for equality of population variances
b) F test for testing equality of several population means
20.3.1 F-test for equality of population variances
Suppose we are interested to find if two
normal populations have same variance. Let X1i (i=1,2,…,n1)
be a random sample of size n1from the first population with variance
σ12
and X2j (j=1,2,…,n2) be another independent random sample
of size n2 from the second normal population with variance σ22.
The two samples are independent of each other.
Under the null hypothesis H0: σ12 = σ22 = σ2 i.e., population variances are equal. In other words the two independent estimates of the common population variance do not differ. The test statistic F = (S12/ S22) ~ F(n1 – 1, n2 – 1) (S12 > S22)
Where S12
and S22 are unbiased estimates of the common
population variance σ2 and are given by
It follows Snedecor’s F- distribution with (n1-1, n2-1)
d.f. i.e., F~F (n1 – 1, n2 –
1). Since F-test is based on the ratio of two variances it is also known as
Variance Ratio Test. If calculated value of F is greater than tabulated value
at α% level of significance H0 is rejected at α percent
level of significance which implies that the two independent estimates of population
variances are heterogeneous. On the other hand if calculated value of F is less
than tabulated F then H0 is not rejected at α percent level of
significance suggesting that the estimates of population variances are
homogenous.
Remarks:
· Since the available tables of the significant values of F are for
the right –tail test, i.e., against an alternative σ12 > σ22, in numerical problems we
will take greater of the variance S12 or S22 in the numerator and adjust
for the degrees of freedom i.e., degree of freedom of the large variance must
be taken in the numerator while computing F.
· In numerical problems, usually
sample variance s2 is given from which S2 can be obtained
on using the relation n s2 = (n-1) S2.
The
procedure is illustrated by following examples
Example 1: In a sample of 8
observations, the sum of squared deviations of items from the mean was 94.5. In
another sample of 10 observations, the value was found to be 101.7. Test
whether the difference is significant at 5% level of significance.
Solution: Let us take the hypothesis that there is no difference in
the variances of two samples i.e., H0: σ12
= σ22, with an alternative H0: σ12
≠ σ22. we are given
![]()
![]()
![]()
![]()
![]()
![]()
Applying
F test
![]()
Tabulated
value of F (7, 9) d.f. at 5%
level of significance is 3.29.
Calculated
value of F is less than the tabulated value, it is not significant. Hence H0
may be accepted and conclude that the difference in the variances of two
samples is not significant at 5% level of significance which implies that the
two population variances are homogenous or the sample have been drawn from the
population having same variances.
Example
2: Two random samples drawn from normal population are :
|
Sample I |
20 |
16 |
26 |
27 |
23 |
22 |
18 |
24 |
25 |
19 |
|
|
|
Sample II |
27 |
33 |
42 |
35 |
32 |
34 |
38 |
28 |
41 |
43 |
30 |
37 |
Obtain
estimates of the variances of two populations and test whether two populations
have same variances.
Solution: Let us take the hypothesis that the two populations have the same
variance i.e.,
H0: σ12 = σ22 = σ02. With an alternative H0:
σ12 ≠ σ22.
Table 20.1
|
Sample I X1 |
|
|
Sample II X2 |
|
|
|
20 |
-2 |
4 |
27 |
-8.00 |
64 |
|
16 |
-6 |
36 |
33 |
-2.00 |
4 |
|
26 |
4 |
16 |
42 |
7.00 |
49 |
|
27 |
5 |
25 |
35 |
0.00 |
0 |
|
23 |
1 |
1 |
32 |
-3.00 |
9 |
|
22 |
0 |
0 |
34 |
-1.00 |
1 |
|
18 |
-4 |
16 |
38 |
3.00 |
9 |
|
24 |
2 |
4 |
28 |
-7.00 |
49 |
|
25 |
3 |
9 |
41 |
6.00 |
36 |
|
19 |
-3 |
9 |
43 |
8.00 |
64 |
|
|
|
|
30 |
-5.00 |
25 |
|
|
|
|
37 |
2.00 |
4 |
|
220 |
|
120 |
420 |
|
314 |
![]()
![]()
![]()
![]()
Applying
F test
![]()
Tabulated value of F(11,9) d.f. at 5% level of
significance is 3.10.
Calculated
value of F is less than the tabulated value, it is not significant. Hence H0
may be accepted and conclude that the difference in the variances of two
samples is not significant at 5% level of significance which implies that the
two populations have the same variance.
20.3.2 F test for
equality of several population means
This test is widely used in
the technique of analysis of variance which plays a very important and
fundamental role in Design of experiments which is discussed in details in next
module.