Module 7. Correlation and regression
Lesson 24
RANK CORRELATION
24.1 Introduction
There are many occasions in problems related with business and industry where it is not possible to measure the variable under consideration quantitatively or where the statistical series is composed of items, the exact magnitudes of which cannot be ascertained. Many characters are expressed in comparative terms such as beauty, intelligence, flavour and body texture of a milk product etc. In such cases the subjects are ranked pertaining to that particular character instead of taking measurements on them. Sometimes, the units are also ranked according to their quantitative measure. In these types of studies, two situations arise, (i) the same set of units is ranked according to two characters A and B (ii) two judges give ranks to the same set of units independently, pertaining to one character only. In both these situations, we get paired ranks for a set of units. For example, (i) two judges are asked to rank ten value added milk products in terms of taste independently in a sensory evaluation experiment whereas it may be difficult to give them a numerical grade in terms of taste, (ii) The students are ranked according to their marks in Operations Research and Statistics. In all these situations, the usual Pearsonian correlation coefficient cannot be used. Hence, the psychologist, Charles Edward Spearman (1906) developed a formula for correlation coefficient, which is known as rank correlation or Spearman’s correlation coefficient.
24.2 Formula of Rank Correlation Coefficient
Suppose we want to find if two characteristics A (flavour) and B (consistency) are related or not. Both the characteristics are incapable of quantitative measurement but can be arranged in order of rank with respect to proficiency of two characteristics. Let X & Y be the random variable denoting the rank of the individuals in the characteristics A & B respectively. It is assumed that there is no tie i.e., no two individuals get the same rank for a characteristic then, obviously X and Y assume numerical values ranging from 1 to n. Then Spearman’s rank correlation coefficient is given by the formula.
![]()
Where di = (Xi - Yi) difference between pairs of rank of some individual in the two characters.
n= number of pairs of observations.
Proof
Let (X1 , Y1) , (X2 , Y2) ,…, (Xn , Yn) be the ranks of the n individuals assigned for two characteristics A & B respectively. In general, an individual will not be equally proficient in both the characteristics.
i.e. (Xi) (the rank of ith
individual in character A) will not be equal to Yi (the rank of the
ith individual in character B).
Let di = (Xi - Yi)
difference between the ranks assigned by ith individual for two
characters A and B.
![]()
![]()
![]()
![]()
![]()
![]()
![]()
![]()
![]()
![]()
![]()
![]()
![]()
![]()
24.3 Features of Spearman’s Rank Correlation Coefficient
a) Spearman’s rank correlation coefficient lies between -1 to +1 i.e., -1 ≤ rs ≤ +1.
b) Sum of the difference of ranks between two variables shall be zero i.e. ∑ di = 0
c) Spearman’s correlation coefficient is distribution free because no assumptions are made about the form of the population from which the sample observations are drawn.
24.4 Computation of Rank Correlation Coefficient
In rank correlation we have three types of problems;
24.4.1 When ranks are given
When ranks are given the following procedure is adopted to find the rank correlation coefficient:
1) Compute
di the difference of ranks i.e., di = Xi - Yi
difference between the ranks of ith individual in two characters A
and B.
2) Compute
di2 i.e., square of the rank difference.
3) Obtain
the sum of squares of rank difference i.e., ∑ di2.
4) Use the following formula to compute rank
correlation.
5) ![]()
The procedure is
illustrated by the following example
Example 1: In a sensory evaluation experiment, two judges accorded the following ranks to eight milk products
|
Judge A |
8 |
7 |
6 |
3 |
1 |
1 |
5 |
4 |
|
Judge B |
7 |
5 |
4 |
1 |
3 |
2 |
6 |
8 |
Find the Spearman’s rank correlation coefficient.
Solution :
Prepare the
following table and calculate di’s and di2’s
as given below
|
Judge A (Xi ) |
8 |
7 |
6 |
3 |
2 |
1 |
5 |
4 |
|
|
Judge B (Yi) |
7 |
5 |
4 |
1 |
3 |
2 |
6 |
8 |
|
|
|
1 |
2 |
2 |
2 |
-1 |
-1 |
-1 |
-4 |
|
|
|
1 |
4 |
4 |
4 |
1 |
1 |
1 |
16 |
|
Calculate rank
correlation coefficient as follows
![]()
24.4.2 When ranks are not given
When we are given the actual data and not the ranks, the following procedure is adopted to find out rank correlation coefficient.
1) First step is to convert the data into ranks the highest (smallest) observation is given rank 1. The next highest (smallest) observation is given rank 2 and so on. It is immaterial in such a way (descending or ascending) the ranks are assigned. However, the same approach should be followed for the entire variable under consideration.
2) Compute
di the difference of ranks i.e., di = Xi - Yi
difference between the ranks of ith individual
in two characters A and B.
3) Compute di2 i.e., square of the rank difference.
4) Obtain the sum of squares of rank difference i.e., ∑di2.
5) Use
the following formula to compute rank correlation
6) ![]()
The procedure is illustrated by the following example
Example 2: Calculate Spearman’s rank Correlation for the following data on marks obtained.
|
X |
80 |
73 |
85 |
36 |
54 |
93 |
65 |
96 |
58 |
88 |
|
Y |
15 |
83 |
95 |
64 |
32 |
16 |
67 |
66 |
85 |
39 |
Solution :
Prepare the
following table and calculate di’s and di2’s
as given below
|
X |
Y |
|
|
|
|
|
80 |
15 |
6 |
1 |
5 |
25 |
|
73 |
83 |
5 |
8 |
-3 |
9 |
|
85 |
95 |
7 |
10 |
-3 |
9 |
|
36 |
64 |
1 |
5 |
-4 |
16 |
|
54 |
32 |
2 |
3 |
-1 |
1 |
|
93 |
16 |
9 |
2 |
7 |
49 |
|
65 |
67 |
4 |
7 |
-3 |
9 |
|
96 |
66 |
10 |
6 |
4 |
16 |
|
58 |
85 |
3 |
9 |
-6 |
36 |
|
88 |
39 |
8 |
4 |
4 |
16 |
|
|
|
|
|
|
∑di2=186 |
Calculate rank correlation coefficient as follows
![]()
24.4.3 When ranks are repeated (or Tie case)
In case of attributes where there is a
tie i.e. if two or more individuals are placed at the same level in
classification with respect to an attribute or if in case of variable data,
there is more than one item with the same value in either or both the series
then Spearman’s rank correlation formula breaks down, since in this case the
variables X and Y don’t take values from 1 to n and consequently ![]() .
In such cases, common ranks are assigned to repeated items. The common ranks
are arithmetic mean of ranks which the items would have got if they were
different from each other and next item will get the rank next to the rank used
in computing the common rank. If there is large number of ranks with tie,
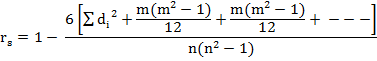
it is advisable to apply correction factor or adjustment factor, (C.F)
.
In such cases, common ranks are assigned to repeated items. The common ranks
are arithmetic mean of ranks which the items would have got if they were
different from each other and next item will get the rank next to the rank used
in computing the common rank. If there is large number of ranks with tie,
it is advisable to apply correction factor or adjustment factor, (C.F)
![]()
where m is the number of times an item is repeated. Then add this
correction factor to ∑di2.
This correction factor is to be added for each repeated value in both the series.
The procedure is illustrated by the following example
Example 3: Calculate Spearman’s rank Correlation for the following data
|
X |
80 |
73 |
80 |
36 |
54 |
93 |
65 |
36 |
58 |
80 |
|
Y |
15 |
83 |
15 |
64 |
32 |
16 |
67 |
64 |
85 |
64 |
Solution
Prepare the
following table and calculate di’s and di2’s
as given below
|
X |
Y |
|
|
|
|
|
80 |
15 |
8 |
1.5 |
6.5 |
42.25 |
|
73 |
83 |
6 |
9 |
-3 |
9 |
|
80 |
15 |
8 |
1.5 |
6.5 |
42.25 |
|
36 |
64 |
1.5 |
6 |
-4.5 |
20.25 |
|
54 |
32 |
3 |
4 |
-1 |
1 |
|
93 |
16 |
10 |
3 |
7 |
49 |
|
65 |
67 |
5 |
8 |
-3 |
9 |
|
36 |
64 |
1.5 |
6 |
-4.5 |
20.25 |
|
58 |
85 |
4 |
10 |
-6 |
36 |
|
80 |
64 |
8 |
6 |
2 |
4 |
|
|
|
|
|
|
∑di2=233 |
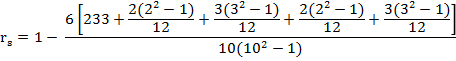
In X series, we see that the value 36 occurs twice. The common rank assigned to each of these values is 1.5, the arithmetic mean of 1 and 2 rank which these observations would have taken if they were different. The subsequent four values 54,58, 65 and 73 are allotted ranks as 3,4,5 and 6 respectively. Again, the value 80 occurs thrice .The common rank assigned to it is 8, the arithmetic mean of 7, 8 and 9 and the next value, viz., 93 gets the rank 10. Similarly in Y series the value 15 occurs twice and the common rank assigned to each is 1.5, the arithmetic mean of 1 and 2.The next value 16 gets the next rank viz., 3. Again the value 64 occurs thrice. The common rank assigned to it is 6, the arithmetic mean of 5, 6 and 7 and the next value, viz., 67 gets the rank 8 and so on. Hence we see that in the X-series the observation 36 occurs twice (m=2) and 80 occurs thrice (m=3) and in the Y series the observation 15 occurs twice (m=2) and 64 occurs thrice (m=3). Hence on applying the correction factor m(m2-1)/12 for each repeated item, we get
Calculate rank correlation coefficient as follows
![]()
24.5 Test of Significance of Rank Correlation Coefficient
The significance of rank correlation coefficient is tested by t-test, as it is done in case of Karl Pearson’s correlation coefficient. Here we test the null hypothesis Ho: ρs=0. vs H1: ρs≠0. The test statistic
![]()
i.e., t follows
student’s t distribution with (n-2) d.f., where n is the number of paired
observations and rs is the rank correlation coefficient.