Module 4. Concepts of sampling methods
Lesson 13
SAMPLING THEORY AND SAMPLING DISTRIBUTION
13.1 Introduction
The science of statistics may broadly be studied under the two heads descriptive and inductive. So far we have confined ourselves to descriptive statistics which help us in describing the characteristics of numerical data. In other part i.e. inductive statistics also known as statistical inference which is termed as logic of drawing valid statistical conclusions about population in any statistical investigation on the basis of examining a part of population known as sample. It is drawn from population in a scientific manner. In all the spheres of life (such as economic, social, scientific, industry etc.) the need for statistical investigation and data analysis is increasing day by day. There are two methods of collection of statistical data i.e. census and sample method. Under census method, information related to the entire field of investigation or units of population is collected; whereas under sample method, rather than collecting information about all the units of population, information relating to only selected units is collected. Before we make a detailed study of both the methods, we will explain some basic concepts related to them.
13.2 Some Basic Concepts
13.2.1 Universe or population
In any statistical investigation interest lies in the assessment of the general magnitude and the study of variation with respect to one or more characteristics relating to individuals belonging to a group. The group of individuals under study is called population or universe. In statistics a universe or population means the entire field under investigation about which knowledge is sought. “It is the totality of persons, objects, items or anything conceivable pertaining to certain characteristics”. In statistical usage, the term population is applied to any finite or infinite collection of individuals as per the statistical dictionary definition given by Kendall and Buckland. It is obvious that for any statistical investigation, complete enumeration of the population is rather impracticable. For example if we want to have an idea of the average per capita monthly income of the people in India, we will have to enumerate all the earning individuals in the country which is rather a very difficult task because of administrative and financial implications. A population can be of two kinds (i) Finite and (ii) Infinite. In a finite population, number of items is definite such as, number of students or teachers in a college, daily milk yield of 500 milch animals in a livestock farm. On the other hand, an infinite population has infinite number of items e.g. the population of pressures at various points in the atmosphere, the population of real numbers between 0 and 1, the population of all integers, number of water drops in an ocean, number of leaves on a tree or number of hairs on the head etc.
13.2.2 Sample
A finite subset of the population, selected from it by using scientific procedure with the objective of investigating its properties is called a sample In other words, selected or sorted units from the population are known as a sample. Thus, sample means some units selected out of a population which represent it. For example, if an investigator selects 100 animals from 2000 animals in a herd then these 100 animals will be termed as a sample and number of the individuals in the sample is called sample size.
13.2.3 Sampling
The process of selecting a sample is called sampling. It is a tool which enables us to draw conclusions about the characteristics of the population after studying only those items which are included in the sample. The main objective of sampling is
· To obtain the maximum information about the characteristics of population with the available sources e.g. time, money, manpower etc.
· To obtain best estimates of population parameter
13.2.4 Parameter and statistic
The statistical constants of the
population like mean (μ), variance (σ2), skewness (β1),
kurtosis (β2), correlation coefficient (ρ) etc. are known
as parameters. Similar statistical measures computed from the sample
observations alone e. g. mean ![]() variance (s2), skewness (b1),
kurtosis (b2), correlation coefficient(r) etc. have been termed by
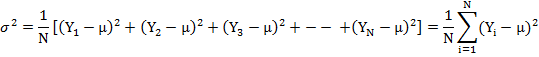
Prof. R. A. Fisher as statistics. Let us consider a finite population of N
units and let Y1 ,Y2 ,Y3 ,---,YN be
the observations on the N units in the population.
variance (s2), skewness (b1),
kurtosis (b2), correlation coefficient(r) etc. have been termed by
Prof. R. A. Fisher as statistics. Let us consider a finite population of N
units and let Y1 ,Y2 ,Y3 ,---,YN be
the observations on the N units in the population.
Mean
(μ)=![]()
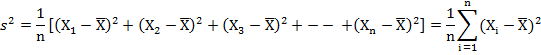
Suppose we draw a sample of size n from
this population. Let X1, X2, X3,---,Xn be
the observations on the sample units. Then we can compute sample
mean![]() and sample variance (s2) as given
below:
and sample variance (s2) as given
below:
Mean
![]() =
=![]()
In practice the
parameter values are not known and their estimates based on sample values are
generally used. Thus statistics which may be regarded as an estimate of the
parameter obtained from the sample is a function of sample values only and vary
from sample to sample. If t is any general statistic which is a function of the
sample observations X1, X2, X3,---,Xn then
a statistic t = f (X1, X2, X3,---,Xn)
is said to be unbiased estimate of population parameter θ if E(t) = θ.
13.2.5 Sampling distribution
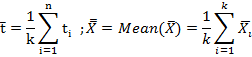
If we draw a sample of size n from a
given finite population of size N, then the total number of possible samples is
NCn = k (say). For each of these samples we can compute
some statistic t = t (X1, X2, ……, Xn) e.g.
mean ![]() ,
the variance s2 etc. as given below.
,
the variance s2 etc. as given below.
Table 13.1
|
Sample number |
Statistic |
||
|
t |
|
s2 |
|
|
1 2 3 - - - k |
t1 t2 t3 - - - tk |
- - -
|
- - -
|
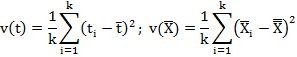
The set of values of the statistic so obtained one for each sample constitutes what is called the sampling distribution of the statistic. For example, the values t1, t2, …, tk determine the sampling distribution of the statistic t. In other words, the statistic t can be regarded as a random variable which can take values t1, t2, …, tk and we can compute various statistical constants like mean, variance, skewness, kurtosis etc. for its distribution e.g. the mean and variance of the sampling distribution of the statistic are given by
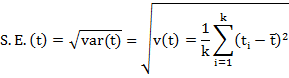
13.2.6 Standard error
The standard deviation of the sampling distribution of a statistic is known as its Standard Error (S.E.). The standard Error of a statistic t is given by:
The standard errors of some of the well known statistics, for large samples, are given below where n is the sample size, σ2 the population variance, P the population proportion and Q= 1 – P, n1 and n2 represent sizes of two independent random samples.
Table 13.2
|
Sr. No. |
Statistic |
Standard Error |
|
1. |
Sample
mean |
|
|
2. |
Sample proportion p |
|
|
3. |
Sample standard deviation |
|
|
4. |
Sample variance (s2) |
|
|
5. |
Sample correlation coefficient( r) |
|
|
6. |
Difference
between two sample means |
|
|
7. |
Difference between two sample Standard deviation (s1-s2)
|
|
|
8. |
Difference between two sample proportion (p1-p2) |
|


13.2.6.1 Utility of Standard Error
1) It plays a very important role in large
sample theory and forms the basis of the testing of hypothesis. Thus,if the
discrepancy between the observed and expected (hypothetical value of a
statistic) is greater than or equal to Zα times S.E., the
hypothesis is rejected at α level of significance otherwise the deviation
is not regarded as significant and is considered as due to fluctuations of
sampling or chance causes.
2) The magnitude of S.E.
gives an index of the precision of the estimate of parameter. The reciprocal of
the S.E. is taken as the measure of reliability or precision of the sample e.g.
S.E. of sample mean and sample proportion are ![]() respectively
which vary inversely as the square root of the sample size. Thus in order to
double the precision which amounts to
reducing the S.E. to one half, the sample size has to be increased four times.
respectively
which vary inversely as the square root of the sample size. Thus in order to
double the precision which amounts to
reducing the S.E. to one half, the sample size has to be increased four times.
3) S.E. enables us to
determine the probable limits/confidence limits within which the population
parameter may be expected to lie.
13.3 Census and Sample Method
There are two methods to collect data
a) Census Method
b) Sample Method
13.3.1 Census method
Census method is that method in which information or data is collected from each and every unit of the population relating to the problem under investigation and conclusions are drawn on their basis. This method is also called as Complete Enumeration Method. For example, suppose some information (like monthly average milk yield, average lactation length, average fat contents in milk samples etc.) is to be collected from 2000 milking cows in a village. For that purpose if we collect data by inquiring each and every household of that village having milking animals then this method will be called as Census method. In this example, the whole village consisting of milking cows i.e. all 2000 cows will be considered as a population and every cow as an individual will be called the unit of the population. Population census and livestock census in India is conducted after every ten years and five years respectively by using census method. The census method seems to provide more accurate and exact information as compared to sample enumeration as the information is collected from each and every unit of the population. Moreover, it affords more extensive and detailed study. This method has limitations and drawbacks given below:
· It requires lot of time and resources in terms of money, manpower and administrative personnel.
· This method can be adopted only by the government and big organization that have resources at their disposal.
· It is very time consuming process.
13.3.2 Sampling method
Sampling method is that method in which data is collected from the sample of items selected from population and conclusions are drawn from them. For example, if a study is to be made regarding the monthly average milk yield of 2000 milking cow in a village, then instead of inquiring each and every household having milking animals of that village, if we collect information by selecting some households say 100 ,then this will be called sampling method. On the basis of sampling method, it is possible to study the monthly average milk yield of the entire population of milking cows in a village. Sampling method has three main stages
· To select a sample
· To collect information from it
· To make inferences regarding the population.
Prof. R.A. Fisher sums up the advantages of sampling techniques over complete enumeration in just four words: speed, economy, adaptability and scientific approach. A properly design and carefully executed sampling plan yields fairly good results, often better than those obtained by the census method.
13.3.3 Importance of sampling method
In modern times sampling method is an important and popular method of statistical inquiry. Besides economic and business world, this method is widely used in daily life. For example, a researcher while preparing paneer wants to evaluate the whole tray of paneer by evaluating a part of this viz. sample of paneer. In the same way, we learn about of a commodity while buying the items of daily use like wheat, rice and pulses, etc. by observing the sample or specimen. In industries, statistical quality control manager inspects the quality of items by examining a few units produced.
13.3.4 Difference between census and sample method
The main difference between the census method and the sampling method are as follows
· In census method, all items relating to a universe are investigated whereas in sampling method only a few sub set of items are inquired.
· Census method is expensive from the point of view of time, money and labour whereas sampling method economizes on them.
·
In
such fields where study of each and every unit of the universe is necessary,
census method is more appropriate. On the contrary, when population is infinite
or vast or liable to be destroyed as a result of complete enumeration, then
sampling method is considered to be more appropriate.