Module 5. Test of significance
Lesson 17
Z-TEST AND ITS APPLICATIONS
17.1 Introduction
In the previous lesson we encountered a problem to decide whether our sample observations have come from a postulated population or not. On the basis of sample observations, a test is performed to decide whether the postulated hypothesis is accepted or rejected and this involves certain amount of risk. The amount of risk is termed as a level of significance. When the hypothesis is rejected, we consider it as a significant result and when a reverse situation is encountered, we consider it as a non-significant result. We have seen that for large values of n, the number of trials, almost all the distributions e.g., Binomial, Poisson etc. are very closely approximated by Normal distribution and in this case we apply Normal Deviate test (Z-test). In cases where the population variance (s) is/are known, we use Z-test. The distribution of Z is always normal with mean zero and variance one. In this lesson we shall be studying the problem relating to test of significance for large samples only. In statistics a sample is said to be large if its size exceeds 30.
17.2 Test of Significance for Large Samples
In cases where the population
variance(s) is/are known, we use Z-test. Moreover when the sample size is
large, sample variance approaches population variance and is deemed to be almost
equal to population variance. In this way, the population variance is known
even if we have sample data and hence the normal deviate test is applicable.The
distribution of Z is always normal with mean zero and variance one. Thus, if X
~ N (μ, σ2)
![]()
From normal probability tables, we have
P[-3≤Z≤3]=P[|Z| ≤ 3] = 0.9973 ⇒ P[|Z| ≤ 3] = 1-P[|Z| ≤ 3] = 0.0027. Thus, the value of Z=3 is regarded as
critical or significant value at all levels of significance. Thus if |Z| ≤ 3, Ho is always rejected. If |Z| <
3, we test its significance at certain level of significance usually at 5% and
sometimes at 1% level of significance. Also P[|Z| >1.96]=0.05 and P[|Z| >2.58]=0.01.Thus,
significant values of Z at 5% and 1% level of significance are 1.96 and 2.58
respectively. If |Z| >1.96, Ho is rejected at 5% level of
significance if |Z| <1.96, Ho
may be retained at 5% level of significance. Similarly |Z|>2.58, Ho
is rejected at 1% level of significance and if |Z| <2.58, Ho is retained at 1% level of significance.
In the following sections we shall discuss the large sample (normal) tests for
attributes and variables.
17.3
Applications of Z Test
17.3.1
Test for single proportion
If the observations on various items or objects are categorized into two classes c1 and c2 (binomial population), viz. defective or not defective item, we often want to test the hypothesis, whether the proportion of items in a particular class, viz., defective items is P0 or not. For example, the management of a dairy plant is interested in knowing that whether the population of leaked pouches filled by automatic milk filling machine is one percent. Thus for binomial population, the hypothesis we want to test is whether the sample proportion is representative of the Population proportion P = P0 against H1: P≠P0 or H1: P>P0 or H1: P<P0 can be tested by Z-test where P is the actual proportion of items in the population belonging to class c1. Proportions are mostly based on large samples and hence Z-test is applied.
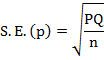
If X is the number of successes in n independent trials with constant probability P of success for each trial then E (X) = P and V (X) = n P Q where Q = 1−P. It is known that for large n, the Binomial distribution tends to Normal distribution. Hence , for large n, X~N (nP, nPQ). Therefore, Z statistic for single proportion is given by
![]()
![]()
and we can apply a normal deviate test.
If in a sample
of size n, X be the number of persons possessing the given attributes then
observed proportion of successes ![]()
![]()
![]()
Since
X and consequently X/n is asymptotically normal for large n, the normal deviate
test for the proportion of success becomes.
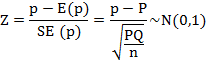
Example 1. In a large consignment of baby food packets, a random sample of 100 packets revealed that 5 packets were leaking. Test whether the sample comes from the population (large consignment) containing 3 percent leaked packets.
Solution:
In this example n=100, X=5, P=0.03, ![]()
H0: P = 0.03 .i.e., the proportion of the leaked pouches in the population is 3 per cent
H1: P ≠ 0.03.
Here, we shall use standard normal
deviate (Z) test for single proportion as under
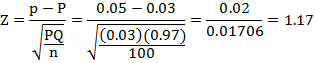
Since calculated value of Z statistic is less than 1.96 therefore H0 is not rejected at 5% level of significance which implies that the sample is representative of the population (large consignment) of packets containing 3% leaked packets.
17.3.2 Test of Significance for difference of proportions
If we have two populations and each item of a population belong to either of the two classes C1 and C2. A person is often interested to know whether the proportion of items in class C1 in both the populations is same or not that is we want to test the hypothesis.
H0: P1=P2 against H1: P1≠P2 or P1>P2 or P1<P2 where P1 and P2 are the proportions of items in the two populations belonging to class C1.
Let X1, X2 be the
number of items belonging to class C1 in random samples of sizes n1
and n2 from the two populations respectively. Then the sample
proportion
![]()
If P1 and P2 are the proportions then E (P1) = P1, E (P2) = P2
![]()
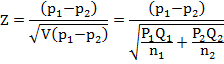
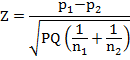
Since for the large sample, p1, and p2 are asymptotically normally distributed, (p1−p2) is also normally distributed. Therefore, the Z-statistic for difference between two proportions is given by
![]()
Since, ![]()
![]()
Since P1 = P2 = P
and Q1 = Q2 = Q, therefore
If the population proportion P1
and P2 are given to be distinctly different that is P1 ≠
P2, then
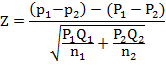
In general P, the common population proportion (under Ho) is not known, then an unbiased estimate of population proportion ‘P’ based on both the samples is used and is given by
![]()
Example 2. Before an increase in excise duty on tea, 400 people out of a sample of 500 persons were found to be tea drinkers. After an increase in excise duty, 400 people were observed to be tea drinkers in a sample of 600 people. Test whether there is a significant change in the number of tea drinkers after increase in excise duty on tea.
Solution: In this example X1 = 400, n1 = 500, X2 = 400, n2 = 600
H0: P1=P2 i.e., there is no change in the number of tea drinkers after increase in excise duty on tea
H1: P1≠P2
Here we shall use standard normal deviate (Z) test for difference of proportions as under:
In our example p1 = 400/500=0.8, p2 = 400/600=0.6667
q1
= 1 - p1 = 0.2,
q2 = 1 - p2 = 0.333
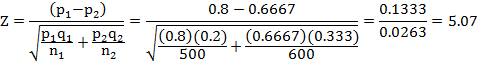
Since calculated value of Z statistic is greater than 3, therefore H0 is rejected at all levels of significance which implies that there is a significant change in the number of tea drinkers after increase in excise duty on tea. It is further observed that the number of tea drinkers have significantly declined after increase in excise duty on tea which is due to decrease in thevalue of p2 (0.667) from the value of p1 (0.8).
Example 3. A machine turns out 16 imperfect articles in a sample of 500. After overhauling it turns 3 imperfect articles in a batch of 100. Has the machine improved after overhauling?
Solution : We are given n1=500and n2=100
p1= Proportions of defective items before overhauling of machine =16/500=0.032
p2= Proportions of defective items after overhauling of machine =3/100=0.03
H0: P1=P2 i.e. the machine has not improved after overhauling.
H1: P1>P2
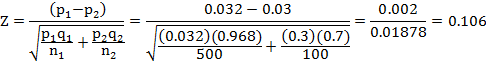
Since Z<1.645 (Right –tailed test), it is not significant at 5% level of significance. Hence we may accept the null hypothesis and conclude that the machine has not improved after overhauling.
17.3.3 Test for significance of single mean
We have seen
that if Xi (i=1, 2, …., n) is a random sample of size n from a
normal population with mean µ and variance σ2,
then the sample mean ![]() is distributed normally with mean μ
and variance σ2/n
i.e.,
is distributed normally with mean μ
and variance σ2/n
i.e., ![]() .Thus
for large samples normal variate corresponding to
.Thus
for large samples normal variate corresponding to ![]() is
is
![]()
In test of significance for a single mean we deal the following situations
1) To test if the mean of the population has a specified value (μ0) and null hypothesis in this case will be H0: μ=μ0 i.e., the population has a specified mean value.
2) To
test whether the sample mean differs significantly from the hypothetical value
of population mean with null hypothesis as there is no difference between
sample mean ![]() and
population mean (μ).
and
population mean (μ).
3) To
test if the given random sample has been drawn from a population with specified
mean μ0 and variance σ2 with null hypothesis
the sample has been drawn from a normal population with specified mean μ0
and variance σ2
In all the above
three situations the test statistic is given by
![]()
If |Z| <1.96, Ho is not rejected at 5% level of significance which implies that there is no significant difference between sample mean and population mean and whatever difference is there, it exists due to fluctuation of sampling.
|Z| >1.96, Ho is rejected at 5% level of significance which implies that there is a significant difference between sample mean and population mean. The above situations are illustrated by following examples:
Example 4. A random sample of 100 students gave a mean weight of 64 kg with a standard deviation of 16 kg. Test the hypothesis that the mean weight in the population is 60 kg.
Solution:
In this example, n=100, µ=60 kg., ![]() =64
kg., σ=16
=64
kg., σ=16
H0: µ=60 kg. , i.e. the mean weight in the population is 60 kg.
We shall use standard normal deviate (z)
test for single mean as under:
![]()
Since calculated value of Z statistic is more than 1.96, it is significant at 5% level of significance. Therefore, H0 is rejected at all levels of significance which implies that mean weight of population is not 60 kg.
Example 5. A sample of 50 cows in a herd has average lactation yield 1290 litres. Test whether the sample has been drawn from the population having herd average lactation yield of 1350 litres with a standard deviation of 65 litres.
Solution:
In this example, n=50, µ=1350 litres, ![]() =1290,
σ=65
=1290,
σ=65
H0: µ=1350 litres i.e., the mean lactation milk yield of the cows in the population is 1350
H1: µ≠1350 litres
We shall use standard normal deviate (Z)
test for single mean as under:
![]()
Since calculated value of Z statistic is more than 3, it is significant at all levels of significance. Therefore, H0 is rejected at all levels of significance which implies that the sample has not been drawn from the population having mean lactation milk yield as 1350 litres or there is a significant difference between sample mean and population mean.
17.3.4 Test of significance for difference of means
Let ![]() be
the mean of a sample of size n1 drawn from a population with mean
μ1 and variance σ12 and let
be
the mean of a sample of size n1 drawn from a population with mean
μ1 and variance σ12 and let ![]() be
the mean of an independent sample of size n2 drawn from another
population with mean μ2 and variance σ22.
Since sample sizes are large.
be
the mean of an independent sample of size n2 drawn from another
population with mean μ2 and variance σ22.
Since sample sizes are large.
![]()
Also
![]() ,
being the difference in means of two independent normal variates is also a
normal variate. The standard normal variate corresponding to
,
being the difference in means of two independent normal variates is also a
normal variate. The standard normal variate corresponding to ![]() is given by
is given by
![]()
Under
the null hypothesis Ho: μ1
= μ2
i.e., the two population means are equal, we get ![]()
![]()
The
covariance terms vanish, since the sample means ![]() are
independent.
are
independent.
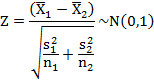
Thus under Ho: μ1 = μ2, the Z statistic is given by
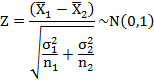
Here
σ12
and σ22
are assumed to be known. If they are unknown then their estimates provided by
corresponding sample variances s12
and s22
respectively are used, i.e., ![]() =
s12
and
=
s12
and ![]() =
s22,
thus, in this case the test statistic becomes
=
s22,
thus, in this case the test statistic becomes
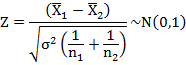
Remarks:
If we want to test whether the two independent samples have come from the same
population i.e., if σ12
= σ22
= σ2
(with common S.D. σ), then under Ho
: μ1
= μ2
![]()
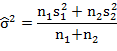
If the common variance σ2 is not known, then we use its estimate based on both the samples which is given by
Example 6. In a certain factory there are two independent processes manufacturing the same item. The average weight in a sample of 100 items produced from one process is found to be 50g with a standard deviation of 5g while the corresponding figures in a sample of 75 items from the other process are 52g and 6g respectively. Is the difference between two means significant?
Solution:
In this example, ![]() ;
; ![]() .
.
Let μ1 and μ2 be the population mean of the weight of items manufactured by two independent processes.
H0: μ1 = μ2 , i.e., mean weights of the items manufactured by two independent processes in the population is same.
H0: μ1 ≠ μ2
Here, we shall use standard normal deviate test (Z-test) for calculating difference between two means as under
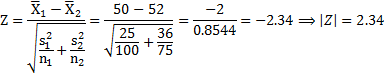
Since calculated
value of Z statistic is more than 1.96, therefore, H0 is rejected at
5% level of significance which implies that there is a significant difference
between mean weights of the items obtained from two manufacturing processes.