Module 9. Project planning and network analysis
Lesson 19
RULES FOR DRAWING NETWORK ANALYSIS
19.1 Introduction
A fundamental ingredient in both PERT and CPM is the use of network systems as a means of graphically depicting a project. When a network is being constructed, certain conventions are followed to represent a project graphically, for it is essential that the relationship between activities and events are correctly depicted. Drawing a network diagram is a relatively easy task, and can be accomplished by listing each task on a piece of paper and representing the sequence in which the tasks take place. Lines and arrows are drawn between the pieces of paper to show which tasks follow on from others. The diagram aims to portray how the tasks relate to one another i.e. which tasks have to be completed before others begin and which tasks can be performed simultaneously. Creating the network is an iterative process and may involve a number of revisions before an optimum solution is found.
19.2 Sequencing
The initial step in project scheduling process is the determination of all specific activities that comprise the project and their interdependence relationships. In order to make a network following points should be taken into consideration.
- What job or jobs precede it?
- What job or jobs run
concurrently?
- What job or jobs follow it?
- What controls the start and
finish of a job?
Since all further calculations are based on the network, it is necessary that a network be drawn with full care. There are many ways to draw a network, in this lesson we will describe the method which follows the precedence table. The following example of preparation of Paneer (Cottage cheese) shows the basic steps required in drawing a network.
Example 1
For preparation of Paneer (Cottage Cheese) the following list represents major activities
i) Receive whole cow/buffalo milk
ii) Standardize milk to obtain desired level of fat percentage
iii) Take citric acid and prepare 1% solution
iv) Heat the citric acid to 70 o C
v) Bring the standardized milk to boil on medium heat
vi) Cool the milk to 70 o C and add slowly the solution of citric acid till yellowish whey separates
vii) Strain the mixture through a clean muslin cloth.
viii) Hold it under running water for a minute and then press out the excess water.
ix) Hang the muslin for 15-20 minutes so that all the whey is drained out.
x) Prepare mould to form Paneer block
xi) Fill the mass into the block and tie the muslin
xii) Place it under something heavy for up to two hours
xiii) Cut the paneer into chunks and used as required.
Based on above list of different activities a precedence table may be formed which is given in Table 19.1
Table
19.1 Precedence table
|
Activity |
Description |
Preceding Activity |
|
A |
Receive whole cow/buffalo milk |
- |
|
B |
Standardize milk to obtain desired level of fat percentage |
A |
|
C |
Take citric acid and prepare 1% solution |
- |
|
D |
Heat the citric acid to 70 o C |
C |
|
E |
Bring the standardized milk to boil on medium heat |
B |
|
F |
Cool the milk to 70 o C and add slowly the solution of citric acid till yellowish whey separates. |
D,E |
|
G |
Strain the mixture through a clean muslin cloth. |
F |
|
H |
Hold it under running water for a minute and press out the excess water. |
G |
|
I |
Hang the muslin for 15-20 minutes and drain out all the whey. |
H |
|
J |
Prepare mould to form Paneer block |
H |
|
K |
Fill the mass into the block and tie the muslin |
J |
|
L |
Place it under something heavy for up to two hours. |
K |
|
M |
Cut the paneer into chunks and use as required. |
L |
In the above table due consideration has been given to precedings of an activity. While drawing the network, other factors will be considered. The activity A has no preceding activity and it is represented by an arrow line (Fig. 19.1). Likewise activity C has no preceding activity and both activities A and C can be done simultaneously so they are shown as concurrent activities. Activities B and D are preceded by the activities A and C respectively. The complete network is shown in Fig 19.1
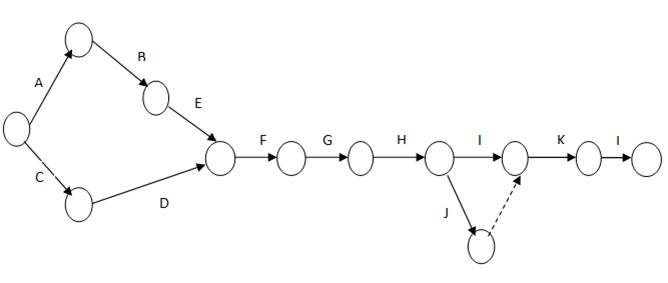
Fig. 19.1 Network diagram
19.3 Guidelines for Drawing Network Diagram
There are number of rules in connection with the handling of events and activities of a project network which are given below:
a) Each activity is represented by one and only one arrow in the network. This implies that no single activity can be represented twice in the network. This is to be distinguished from the case where one activity is broken into segments. In such a case each segment may be represented by a separate arrow.
b) No two activities can be identified by the same beginning and end event. In such cases, a dummy activity is introduced to resolve the problem as shown in Fig. 19.2
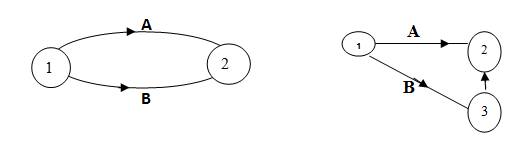
Fig. 19.2 Using a dummy activity
c) In order to ensure the correct precedence relationship in arrow diagram following question must be checked whenever any activity is added to a network.
What activity must be completed immediately before this activity can start?
What activities must follow this activity?
What activities must occur simultaneously with this activity?
d) Thus a network should be developed on the basis of logical or technical dependence.
e) The arrows depicting various activities are indicative of logical precedence only; hence length and bearing of the arrows are of no significance.
f) The flow of the diagram should be from left to right.
g) Two events are numbered in such a way that the event of higher number can happen only after the event of lower number is completed.
h) Arrows should be kept straight and not curved. Avoid arrow which cross each other.
i) Avoid mixing two directions vertical and standing arrows may be used if necessary.
j) Use dummy activity freely in rough graph but final network should have only reluctant dummy.
k) The network has only one entry point called the start event and one point of emergence called end event.
l) Angle between the arrows should be as large as possible.
19.4 Error in Drawing Network
There are three types of errors which are common in network diagrams
19.4.1 Dangling error
To disconnect an activity before the completion of all activities in a network diagram is known as dangling.
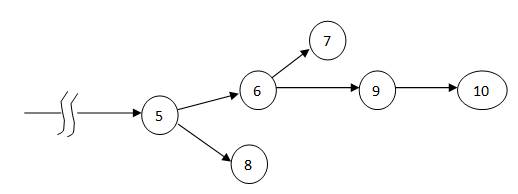
Fig. 19.3 Dangling error
In Fig. 19.3 the activity 5 to 8, 6 to 7 are known as dangling error. These are not last activities in the network.
19.4.2 Looping error
Looping error is also known as cyclic error in the network. Drawing an endless loop in a network diagram is known as error of looping as shown in Fig. 19.4
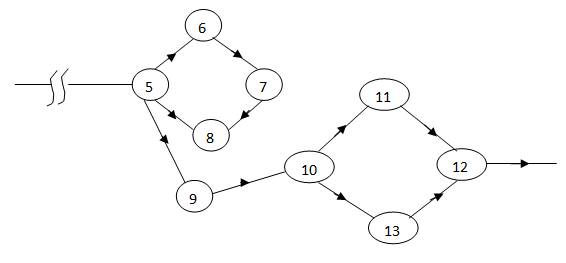
Fig. 19.4 Appearance of a loop in the network
19.4.3 Reductancy error
Unnecessarily inserting the dummy activity in a network diagram is known as error of reductancy as shown in Fig 19.5 in which putting an dummy activity from 10 to 12 is a reductancy error.
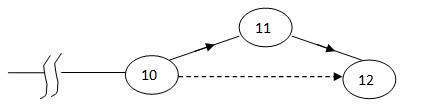
Fig. 19.5 Reductancy error
19.5 Labeling of a Network Diagram
For network representation it is necessary that various nodes be properly labeled. For convenience, labeling is done on a network diagram. A standard procedure called i-j rule developed by D.R.F Fulkerson is most commonly used for this purpose.
Fulkerson’s i-j Rule
Step 1: First, a start event is one which has arrows emerging from it but not entering it. Find the start event and label it as number1.
Step 2: Delete all arrows emerging from all numbered events. This will create at least one new start event out of the preceding events.
Step 3: Number all new start events ‘2’, ‘3’ and so on. No definite rule is necessary but numbering from top to bottom may facilitate other users using the network when there are more than one new start event.
Step 4: Go on repeating step no. 2 & 3 until the end reached.
These rules are illustrated by taking into consideration the Example 19.1 and network diagram as shown in Fig.19.6
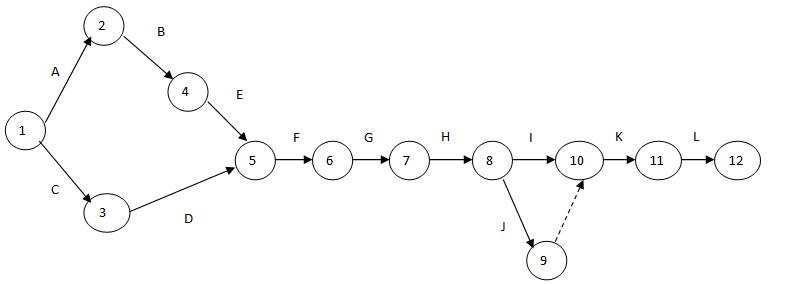
Fig. 19.6 Network diagram of preparation of paneer