Module 9. Project planning and network analysis
Lesson 21
PROJECT EVALUATION AND REVIEW TECHNIQUE (PERT)
21.1 Introduction
The network method discussed so far may be termed as deterministic, since estimated activity times are assumed to be known with certainty. While this assumption holds for the CPM analysis. In most of the projects, these activity times are random variables. A new technique known as Project Evaluation and Review Technique (PERT) was devised in 1958 for the POLARIS missile program by the Program Evaluation Branch of the Special Projects office of the U. S. Navy, helped by the Lockheed Missile Systems division and the Consultant firm of Booz-Allen & Hamilton.
21.2 Project Evaluation & Review Technique (PERT)
In research project of designing a new machine or development of a new dairy product, various activities to be performed are based on judgment. A reliable time estimate is difficult to get because the technology is changing rapidly. Time values are subjected to variation. The main objective of the analysis through PERT is to find out the completion for a particular event within specified date. What are the chances of completing the job? This approach takes into account uncertainties. In this approach three time values are estimated with each activity: Optimistic time, most likely time and Pessimistic time. The three time values provide a measure of uncertainty associated with that activity.
21.2.1 Optimistic time
It is the shortest possible time in which the activity can be finished and assumes that everything goes very well. In other words, it is the estimate of the minimum possible time, which an activity takes to complete under ideal conditions i.e. no provision are made for breakdown, delays etc. They are generally denoted by (t0) or (a).
21.2.2 Most likely time
This is estimate of the normal time the activity would take. This assumes normal delays. It is denoted by (tm) or (m). If a graph is plotted between the time of completion and frequency of completion in that period, the highest frequency of occurrence is denoted by most likely time as shown in Fig. 21.1.
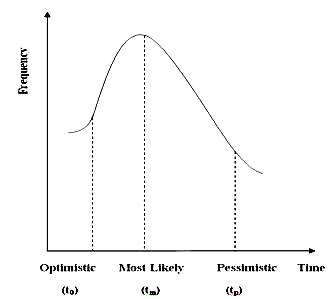
Fig. 21.1 Time distribution curve
21.2.3 Pessimistic time
The longest time, the activity could take if everything goes wrong. In other words, it is the longest time the activity can conceivably take. This is generally denoted by (tp) or (b).
The three time values are shown in Fig. 21.1.
The PERT technique makes the following assumptions:
· Activity times are statistically independent and usually associated with ‘beta’ distribution.
· There are enough activities involved in the network and totals of activity times based on their means and variances will be normally distributed.
· The three estimates of the activity duration can be obtained for each activity.
In PERT calculation, all values are used to obtain the expected value.
21.2.4 Estimated time
This is the average time an activity will take if it is to be repeated large number of times and is based on the assumption that the activity time follows Beta distribution.
![]()
21.2.5 Variance
Variance of each activity is
given by formula:
![]()
where to (a) , tp (b) and tm(m) are optimistic , pessimistic and mostly likely times respectively.
Once the expected times of the activities are obtained, the critical path of the project network is determined using three time estimates. Having found the critical path, the PERT methodology assumes that the aggregation of the mean times and the summation of the variances of critical jobs would yield the expected project duration and its variance. PERT uses the variance of critical path activity to help in determining the variance of the overall project. Project variance is computed by summing variance of just critical activities.
21.3 PERT Algorithm
The various steps involved in the PERT network for analyzing any project are summarized below:
i) Develop a list of activities involved in the project including the immediate predecessors.
ii) Draw the network diagram using the rules and conventions as discussed before.
iii) Number the events in ascending order from left to right
iv) From the three time estimates compute the expected time (te) for each activity using the formula
![]()
Using the expected activity time estimates, determine the earliest start time
and earliest finish time for each activity .
v) Compute the latest start time and latest finish time and the float associated with each activity. Find the activities with zero total float which are known as critical activities. From these critical activities find the critical path.
vi) Using the value for tp (b) and to(a) , calculate the variance (σ2) by using the formula
![]()
vii) Use the variability in the activity times to estimate the variability of the project completion date; using this estimate compute the probability of meeting a specified date by using the standard normal equation
![]()
where Z is a standard normal
variate
21.4 Illustrative Examples on PERT
The computation procedure used for PERT is described in the examples 1and 2
Example 1:
A small project is composed of nine activities whose time estimates are listed in the following table:
|
Activity |
t0 |
tp |
tm |
|
1-2 |
5 |
10 |
8 |
|
1-3 |
18 |
22 |
20 |
|
1-4 |
26 |
40 |
33 |
|
2-5 |
16 |
20 |
18 |
|
2-6 |
15 |
25 |
20 |
|
3-6 |
6 |
12 |
9 |
|
4-7 |
7 |
12 |
10 |
|
5-7 |
7 |
9 |
8 |
|
6-7 |
3 |
5 |
4 |
a) Find the expected task time and their variance.
b) Earliest and latest expected time of each node.
c) Critical path
d) Probability that project will complete in 41.5 weeks and 44weeks.
Solution:
The expected task time and variances of
different activities are computed by the following formulae:
![]()
and
![]()
and
these values are given in following table
|
Activity |
t0 |
tp |
tm |
|
|
|
1-2 |
5 |
10 |
8 |
47/6 |
25/36 |
|
1-3 |
18 |
22 |
20 |
20 |
16/36 |
|
1-4 |
26 |
40 |
33 |
33 |
196/36 |
|
2-5 |
16 |
20 |
18 |
18 |
16/36 |
|
2-6 |
15 |
25 |
20 |
20 |
100/36 |
|
3-6 |
6 |
12 |
9 |
9 |
36/36 |
|
4-7 |
7 |
12 |
10 |
59/6 |
25/36 |
|
5-7 |
7 |
9 |
8 |
8 |
4/36 |
|
6-7 |
3 |
5 |
4 |
4 |
4/36 |
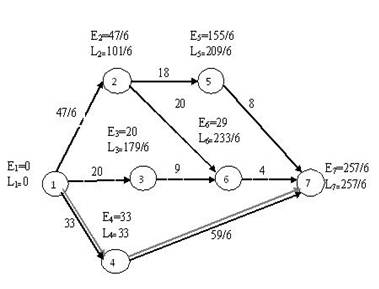
Construct the network diagram showing earliest and latest expected time of each node.
Rule to find out variance of Events:-
We
take initial value of variance V1 = 0
![]()
![]()
![]()
![]()
![]()
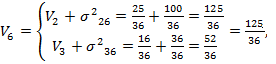
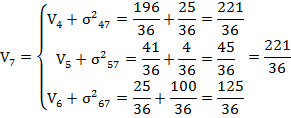
NOTE: At merge point the variance is computed along the longest path in case of two path having the same length the larger of the two variance of that event.
Critical path is 1-4-7 and total duration is 257/36 = 42.833 weeks with variance = 221/36
Now probability that project will
complete in 41.5 weeks is

Hence, there are 29.81% chances that project will be completed before 41.5 weeks.
Now probability that project will complete in 44 weeks is
Hence, there are 99.81% chances that project will be completed before 44 weeks.
Example 2
The following table gives the
estimates of optimistic time (t0), most likely time (tm)
and pessimistic time (tp) of different activities of a project.
|
Activity |
t0 |
tm |
tp |
|
1-2 |
4 |
8 |
12 |
|
2-3 |
1 |
4 |
7 |
|
3-4 |
8 |
12 |
16 |
|
3-5 |
3 |
5 |
7 |
|
4-5 |
0 |
0 |
0 |
|
4-6 |
3 |
6 |
9 |
|
5-7 |
3 |
6 |
9 |
|
5-8 |
4 |
8 |
6 |
|
6-10 |
4 |
6 |
8 |
|
7-9 |
4 |
8 |
12 |
|
8-9 |
2 |
5 |
8 |
|
9-10 |
4 |
10 |
16 |
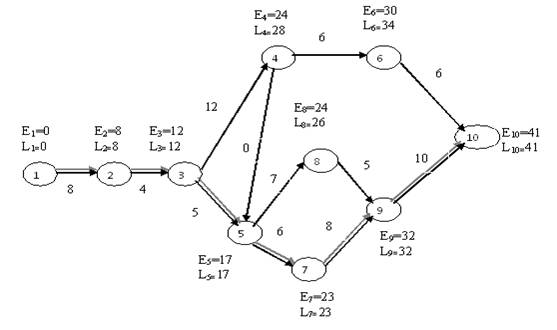
i) Construct the network diagram when it is given that scheduled completion is 40 days.
ii) Calculate the probability of finishing the project
a) within the scheduled time
b) less than 45days
c) less than 38 days.
Solution :
The
expected task time and their variances are given in following table
|
Activity |
t0 |
tm |
tp |
te |
σ2 |
|
1-2 |
4 |
8 |
12 |
8 |
64/36 |
|
2-3 |
1 |
4 |
7 |
4 |
36/36 |
|
3-4 |
8 |
12 |
16 |
12 |
64/36 |
|
3-5 |
3 |
5 |
7 |
5 |
16/36 |
|
4-5 |
0 |
0 |
0 |
0 |
0 |
|
4-6 |
3 |
6 |
9 |
6 |
36/36 |
|
5-7 |
3 |
6 |
9 |
6 |
36/36 |
|
5-8 |
4 |
8 |
6 |
7 |
4/36 |
|
6-10 |
4 |
6 |
8 |
6 |
16/36 |
|
7-9 |
4 |
8 |
12 |
8 |
64/36 |
|
8-9 |
2 |
5 |
8 |
5 |
36/36 |
|
9-10 |
4 |
10 |
16 |
10 |
144/36 |
From the table it is clear that the activity 4-5 is dummy activity.
The network diagram with earliest time and latest times are given below
Rule to find out variance of Events:
We take initial value of variance V1 = 0
![]()
![]() ,
, ![]() ,
,
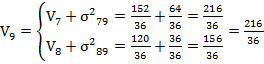
![]()
![]()
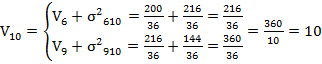
![]()
![]()
![]()
 ,
,
The
critical path is 1-2-3-5-7-9-10 with expected time for completion of the
project is 41 days with variance =10.
a) Probability
that project will complete in given time i.e. 40 days is

Hence, there are 37.83% chances that
project will be completed in the stipulated time of 40 days.
b) Probability
that project will complete in 45 days is

Hence
, there are 89.62% chances that project will be completed before 45 days.
c) Probability
that project will complete in 38 days is

Hence ,there are only 17.36% chances that project will be completed before 38 days.
21.5 Comparison between PERT and CPM
As stated earlier both PERT and CPM techniques were developed independently with different set of objectives. However, the basic differences between the two are given below:
|
PERT |
CPM |
|
|
1. |
It is probabilistic model with uncertainty in activity duration. The duration of each activity is normally computed from multiple time estimates. |
A deterministic model with well known activity (single) time based upon the past experience. It does not deal with uncertainty with time. |
|
2. |
PERT is said to be an event oriented as the result of analysis are expressed in terms of events. |
It is an activity oriented as its results are calculated on the basis of activities. |
|
3. |
It uses dummy activities to represent project sequencing of the activities. |
It does not make use of dummy activities to represent the project sequencing. |
|
4. |
PERT is usually used for those projects where time required to complete various activities is not known a priori. |
This is commonly used for those projects which are repetitive in nature and here one has prior experience of handling similar projects. |
|
5. |
PERT is generally applied for planning and scheduling research program and developing projects. |
CPM is generally used for construction and business problems. |
|
6. |
PERT analysis usually does not consider cost. |
CPM deals with the cost of project schedules and their minimization. |
|
7. |
PERT is an important control device as it assists the management in controlling a project by constant review of such delays in the activities. |
It is difficult to use CPM as controlling device because it requires repetition of the entire evaluation of project each time the changes are introduced in the network. |
|
8. |
PERT helps the manager to schedule and coordinate various activities so that project can be completed on scheduled time. |
CPM plans dual emphasis on time cost and evaluates the tradeoff between project cost and time. |
|
9. |
It makes use of the statistical devices in the determination of time estimates. |
It does not make use of the statistical devices in the determination of time estimates |