Site pages
Current course
Participants
General
Module 1: Introduction and Concepts of Remote Sensing
Module 2: Sensors, Platforms and Tracking System
Module 3: Fundamentals of Aerial Photography
Module 4: Digital Image Processing
Module 5: Microwave and Radar System
Module 6: Geographic Information Systems (GIS)
Module 7: Data Models and Structures
Module 8: Map Projections and Datum
Module 9: Operations on Spatial Data
Module 10: Fundamentals of Global Positioning System
Lesson 17 Applications of GIS
17.1 Contributing Disciplines
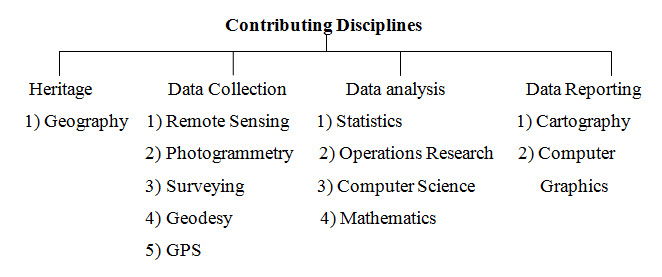
GIS is convergence of technological fields and traditional disciplines. GIS has been called an "enabling technology" because of the potential it offers for the wide variety of disciplines dealing with spatial data. Many related fields of study provide techniques which make up GIS. These related fields emphasise data collections while GIS brings them together by emphasising integration, modelling and analysis. Thus GIS often claims to be the science of spatial information. Fig. 17.1 shows the technical and conceptual development of GIS. (http://www.geog.ubc.ca/courses/klink/gis.notes/ncgia/u01.html#SEC1.2). The list of contributing disciplines can be classified according to (1) Heritage (2) Data Collection (3) Data analysis (4) Data Reporting .
(http://gisserver.civil.iitd.ac.in/gislab/Lecture/Lecture%2001_Introduction%20to%20GIS.pdf).
 +
+
The contributing disciplines for the evolution of a GIS (Burrough, 1998) are geography, cartography, remote sensing, surveying and photogrammetry, computer science technology, mathematics, and statistics.
(http://www.geog.ubc.ca/courses/klink/gis.notes/ncgia/u01.html#SEC1.2).
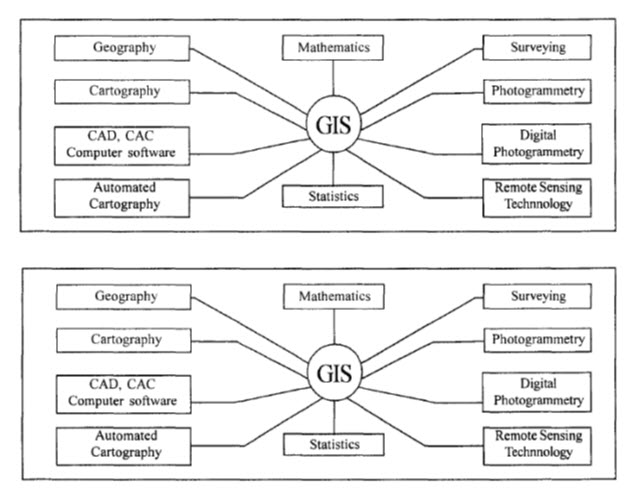
Fig. 17.1 GIS: the result of linking parallel developments in many separate spatial data processing disciplines.
(Source: http://www.geog.ubc.ca/courses/klink/gis.notes/ncgia/u01.html#SEC1.2)
Geography: is broadly concerned with understanding the world and man's place in it. Geography has a long tradition in spatial analysis, and provides techniques for conducting spatial analysis and a spatial perspective on research.
Cartography: is concerned with display of spatial information. It is now the main source of input data for GIS (maps) and has a long tradition in the design of maps which is an important form of output from GIS. It provides methods for digital representation and manipulation of cartographic features and methods of visualization.
Remote Sensing: is becoming an important source of geographical data by providing digital images derived from space and the air. Remote sensing provides techniques for data acquisition and processing anywhere on the globe at a low cost, and consistent update potential. While integrated with GIS, remotely sensed imagery can be merged with other data in a GIS providing real-time spatial information. The first part of this book enlightens the concepts and the potential utility of remote sensing.
Surveying and Photogrammetry: provide high quality data on positions of cadastral objects like land parcel and building, and topography. Aerial photogrammetry deals with the photographs taken by an aerial camera on board aircraft at different altitudes. Aerial photogrammetry is one of the most powerful data-capturing techniques for the creation of GIS spatial database. The relevant data can be extracted from the aerial photographs of various scales (Fig. 17.2), and may be used as input for GIS. Digital orthophotos provide the source of digital data. These products are scanned airphotos that have been rectified to eliminate displacement caused by variable elevation of the ground surface and the tilt of the camera. Properly registered with other digital data sets, these images can be used directly as backdrops for vector data or to provide a basemap for onscreen digitising. The user may abstract information on land use, vegetation type and other aspects of the landscape from the photograph. Curran (1989) identifies six characteristics of aerial photographs of immense value as a data source for GIS. They are (i) wide availability, (ii) low cost, (iii) wide area views, (iv) time - freezing ability, (v) high spectral and spatial resolution, and (vi) three-dimensional perspective.
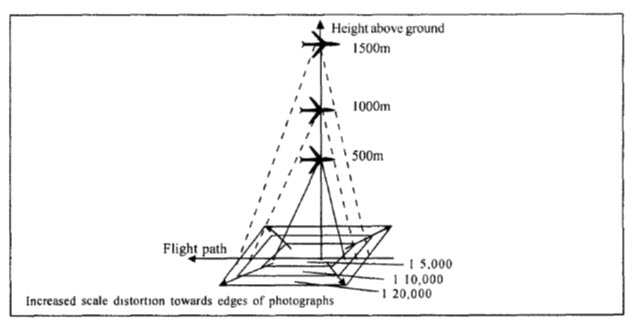
Fig. 17.2. Varying scale on Aerial photographs.
(Source: http://www.geog.ubc.ca/courses/klink/gis.notes/ncgia/u01.html#SEC1.2)
Geodesy: provides source of high accuracy positional control for GIS. It concentrates on placing objects accurately on global context. Many applications of GIS require use of optimizing techniques for decision-making which involves Operational research.
Computer Sciences: Computer Assisted Design (CAD) provides software, techniques for data input, display and visualisation, and representation, particularly in 3-dimensions. Advances in computer graphics provide hardware and software for handling and displaying graphic objects. Data Base Management System (DBMS) contributes methods for representing data in digital form and procedures for system design and update. Artificial intelligence (AI) uses the computer to make choices based on available data in a way that is seen to enhance the human intelligence and decision-making. Using AI, computer can act as an "expert" in such functions as designing maps, generalizing map features and classification.
Mathematics: Several branches of mathematics, especially geometry and graph theory, are used in GIS system design and analysis of spatial data.
Statistics: is used to build models and perform spatial data analysis in GIS. Statistics is also important in understanding issues of error, quality and uncertainty in GIS data.
Availability of large quantities of spatial data in the form of digital aerial photograph, digital remote sensing imagery, advancement of computer hardware, software and software development, increasing demand of spatial information for management, and infrastructure development parameters, lead to have a system to handle all these requirements. In order to handle such data to meet these demands, to store, retrieve, handle, analyse, manipulate, and display the results, it requires computer based system. Such a system is Geographical Information System (GIS).
(http://www.geog.ubc.ca/courses/klink/gis.notes/ncgia/u01.html#SEC1.2)
17.2 GIS Workflow
There are five essential elements that a GIS must contain. They are data acquisition, preprocessing, data management, manipulation and analysis, and product generation. For any application of GIS, it is important to view these elements as a continuing process. Figs. 17.3 and 17.4 show the work flow process of GIS in procedural perspective. Data acquisition is the process of identifying and gathering the data required for any given application. Two main types of data acquisition are primary data sources are those collected in digital format specifically for use in a GIS project. Secondary sources are digital and analog datasets that were originally captured for another purpose and need to be converted into a suitable digital format for use in a GIS project. The processes of data collection are also variously referred to as data capture, data automation, data conversion, data transfer, data translation, and digitizing. Data collection is a time consuming, tedious, and expensive process. Preparation involves obtaining data, redrafting poor-quality map sources, editing scanned map images, removing noise, setting up appropriate GIS hardware and software systems to accept data. Digitizing and transfer are the stages where the majority of the effort will be expended.
A GIS must be able to convert data from one structure to another. The Data acquisition stage collects raw imagery data that is redundant & needs to be stitched together into a more apt data stream. Data pre-processing involves digitization of the acquired data that includes:
3D data processing- Creating realistic models of buildings and structures by visualizing them in 3-Dimensional environment is termed as 3D data processing. Roof detail and elevation details of building or structure are truly represented in this process.
Value addition to Image data for large scale mapping- In order to transfer the spatial components from images to maps, it is essential to have accurate base maps on large scales. It is necessary to generate large scale base maps for use in various thematic applications.
(http://www.albireotelematics.com/pre_processing.html)
The other essential preprocessing procedures include: (a) format conversion, (b) data reduction and generalisation, (c) error detection and editing, (d) Merging of points into lines, and lines into polygons, (e) Edge matching and tiling, (f) Rectification/registration, (g) Interpolation, and (h) Interpretation.
(http://www.geog.ubc.ca/courses/klink/gis.notes/ncgia/u01.html#SEC1.2).
The functions of database management govern the creation of an access to the database itself. These functions provide consistent methods for data entry, update, deletion, and retrieval. Modern database management systems isolate the users from the details of data storage, such as, the particular data organisation on a mass storage medium. A modern Database Management System (DBMS) is used to create GIS database, that is, attribute database.
(http://www.geog.ubc.ca/courses/klink/gis.notes/ncgia/u01.html#SEC1.2).
Any DBMS makes assumptions about the data which it handles. Two ways to use DBMS within GIS
Total DBMS solution: In this all data are accessed through the DBMS, so it must fit the DBMS designer.
Mixed solution: In this some data (usually attribute tables and relationships) are accessed through the DBMS as they fit the model well, while some data(usually locational) are accessed directly because they do not fit the DBMS model.
(http://gis.nic.in/gisprimer/dbms.html)
Storage and retrieval mechanisms include the control of physical storage of the data in memory, disk or tape, and mechanisms for its retrieval to serve the needs of the other three components. In a disaggregate GIS this data storage may be physically more from the rest .of the system, and may meet the database requirements. This module includes the software structures used to organise spatial data into models of geographic reality.
(http://www.geog.ubc.ca/courses/klink/gis.notes/ncgia/u01.html#SEC1.2)
The development of new derived data layers, which may form the input to further analysis, is an important function of any GIS. The list of data manipulation and analysis operations are, (i) reclassification and aggregation, (ii) Geometric Operations: as rotation, translation and scaling, rectification, and registration, (iii) Controlled determination, (iv) Data structure conversion, (v) Spatial operations of connectivity and neighborhood operations, (vi) Measurement of Distance and Direction, (vii) Statistical analysis as descriptive statistics regression, correlation, and cross-tabulation, and (viii) Modelling.
(http://www.geog.ubc.ca/courses/klink/gis.notes/ncgia/u01.html#SEC1.2)
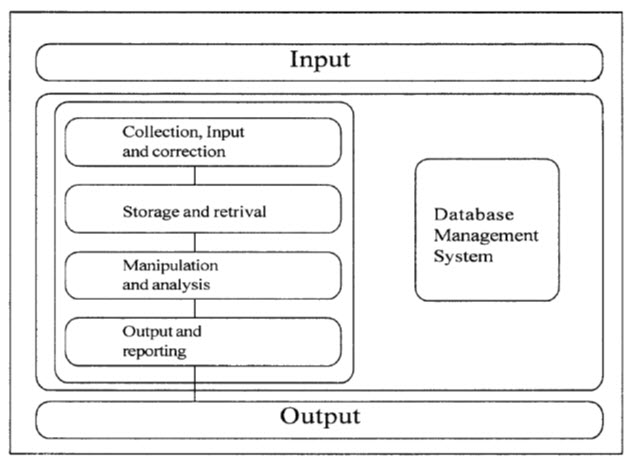
Fig. 17.3. Workflow process of GIS (Procedural perspective)
(http://www.geog.ubc.ca/courses/klink/gis.notes/ncgia/u01.html#SEC1.2)
This operation or subsystem represents the whole spectrum of techniques available for the transformation of the digital model by mathematical means. A library of data-processing algorithms is available for the transformation of spatial data, and incorporated in new visual maps. Using these techniques it is possible to deliberately change the characteristics of the data representation in order to meet theoretical requirements. It is equally possible to mishandle or unintentionally distort the digital map at this state.
(http://www.geog.ubc.ca/courses/klink/gis.notes/ncgia/u01.html#SEC1.2)
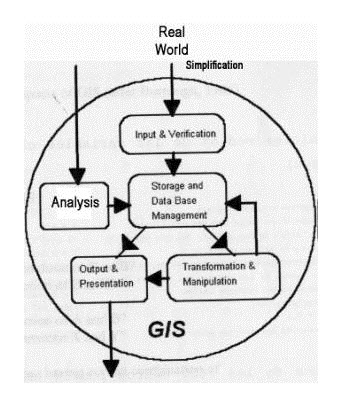
Fig. 17.4. Workflow process of GIS (Procedural perspective)
(Source: http://people.aub.edu.lb/~webeco/GIS%20course.htm)
Output and Presentation is the phase where final outputs from the GIS are created. These output products might include statistical reports, maps, and graphics of various kinds. Some of these products are softcopy images and some are hardcopy.
17.3 Standard Software
Software that is used to create, manage, analyze and visualize geographic data is usually incorporated under the umbrella term ‘GIS software’ (Steiniger & Weibel, 2009). Typical applications for GIS software include the evaluation of places for the location of new stores, the management of power and gas lines, the creation of maps, the analysis of past crimes for crime prevention, route calculations for transport tasks, the management of forests, parks and infrastructure, such as roads and water ways, as well as applications in risk analysis of natural hazards, and emergency planning and response. For this multitude of applications different types of GIS functions are required and different categories of GIS software exist, which provide a particular set of functions needed to fulfill certain data management tasks. Different functional categories of GIS software can be identified with respect to the tool sets that GIS software offers, and with respect to the tasks that can be accomplished. Such tasks involve basic activities that are common to daily computer usage such as (1) data visualization and exploration, (2) data creation, (3) data editing and (4) data storage. Other common GIS tasks include (5) data conflation, i.e., integration of data from different sources (Blasby, Davis, & Kim, 2002), (6) data queries to select a subset of the data, (7) data analysis, which we consider to be the creation of new information (output) from existing data (input), (8) data transformation, as some analysis tasks require the user to transform, or manipulate, the data beforehand (e.g. transform the data into a different coordinate system, or convert them from raster to vector format), and lastly, (9) the creation of maps - the most common method used to visualize analysis and query results. (Hunter & Steiniger, 2012).
GIS software is the processing engine and a vital component of an operational GIS. It is made up of integrated collections of computer programs that implement geographic processing functions. The three key parts of any GIS software system are the user interface, the tools (functions), and the data manager. All three parts may be located on a single computer or they may be spread over multiple machines in a departmental or enterprise configuration. (Longley, 2005).
Steiniger and Weibel (2009) identified seven major types of GIS software: (i) Desktop GIS, (ii) Spatial Data Base Management Systems (SDBMS), (iii) Web Map Server, (iv) Server GIS, (v) Web GIS clients, (vi) Mobile GIS, and (vii) Libraries and Extensions. For the purpose of this survey we did split the last category “Libraries and Extensions” into the two categories: “Libraries” and “GIS Extensions, Plug-ins and APIs”. Web Map Server and Web GIS clients have been subsumed under the category “Software for Internet Mapping Applications”. Furthermore, we extend the set to include two additional categories (viii) Remote Sensing Software, which could be considered a special form of desktop GIS, and (ix) Exploratory Spatial Data Analysis (ESDA) software. Fig. 1 characterizes the different software types with respect to GIS functionality as defined above.
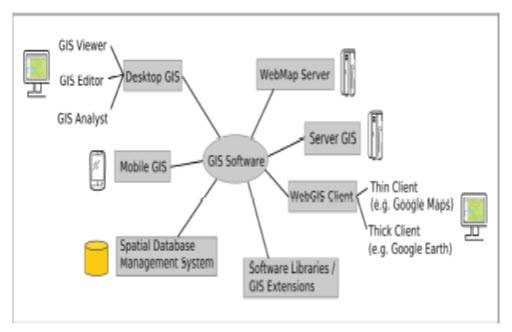
Fig. 17.5. Different types of GIS software.
(Source: Steiniger and Weibel, 2009)
17.3.1Popular GIS packages
A large number of GIS software options are available as open-source or commercial products. Following is a brief summary of some of the more popular GIS packages. A large listing of GIS software can be found at http://en.wikipedia.org/wiki/GIS_software.
17.3.1.1 Proprietary GIS
ArcGIS: ArcGIS is the name of a suite of GIS software product lines produced by ESRI (http://www.esri.com/). At the desktop GIS level, ArcGIS can include: ArcReader, which allows one to view and query maps created with the other Arc products; ArcView, which allows one to view spatial data, create maps, and perform basic spatial analysis; ArcEditor, which includes all the functionality of ArcView as well as more-advanced tools for manipulation of shape files and geodatabases; or ArcInfo, the most advanced version of ArcGIS, which includes added capabilities for data manipulation, editing, and analysis. There are also server-based ArcGIS products as well as ArcGIS products for personal digital assistants (PDAs). Extensions can be purchased separately to increase the functionality of ArcGIS.
AutoCAD: AutoCAD is popular engineering CAD software produced by Autodesk (http://usa.autodesk.com/). AutoCAD Map 3D software is a leading engineering platform that bridges the gap between CAD and GIS. When combined with Autodesk Map Guide technology, AutoCAD Map 3D provides a way to publish data to the Web or an intranet.
Cadcorp: Cadcorp (http://www.cadcorp.com/) is the developer of GIS software and Open GIS standard (e.g., Read/Write Open-Source Post GIS database). Products include a Spatial Information System (SIS), which runs on Microsoft Windows and encompasses desktop GIS modules, ActiveX- and COM-based developer kits, Web-based GIS software (GeognoSIS), and a mobile data-capture solution (mSIS).
ERDAS IMAGINE: ERDAS IMAGINE is a raster graphics editor and remote-sensing application designed by ERDAS, Inc. (http://www.erdas.com/). It is aimed primarily at geospatial raster data processing that allows the user to display and enhance digital images. It is a toolbox allowing the user to perform numerous operations on an image and generate an answer to specific geographical questions.
IDRISI: GIS developed by Clark Labs (http://www.clarklabs.org/products/) at Clark University, Massachusetts. IDRISI Andes is an integrated GIS and image-processing software providing over 250 modules for spatial analysis and display. Originally developed under United Nations sponsorship, the IDRISI is widely used worldwide.
Intergraph: Intergraph (http://www.intergraph.com/) provides software and services for infrastructure management for the electric, gas, water, pipeline, utility, and communications industries. Products include GeoMedia, GeoMedia Professional, GeoMedia WebMap, and add-on products for industry sectors, as well as photogrammetry.
MapInfo: MapInfo (http://www.mapinfo.com/) GIS software products include the desktop GIS software, MapInfo Professional, MapXtreme 2005, and MapXtreme Java for Webbased and desktop client mapping, as well as developer tools such as MapBasic.
Micro Station: Micro Station is a suite of CAD/GIS software products for 2-D and 3-D design and drafting, developed and sold by Bentley Systems (http://www.bentley.com/). It is used by engineering designers for transportation and for water and wastewater utilities. Bentley also offers GIS-based water resources modeling software for water, sewer, and storm water systems (Sewer CAD, Water CAD, and Storm CAD). (Johnson, 2009)
17.3.1.2 Open-Source GIS
GRASS: GRASS (Geographic Resource Analysis Support System) is a public-domain open-source raster GIS developed as a general-purpose spatial modeling and analysis package (Neteler and Mitasova 2008). GRASS is a raster/vector GIS, image processing system, and graphics production system. GRASS contains over 350 programs and tools to render maps and images on monitor and paper; manipulate raster, vector, and sites data; process multispectral image data; and create, manage, and store spatial data. GRASS uses both an intuitive Windows interface as well as command-line syntax for ease of operation. (Johnson, 2009)
17.3.2 Desktop GIS Software
Desktop GIS software is probably the most common GIS software in use. The company ESRI (2012) defines desktop GIS as mapping software that is installed onto and runs on a personal computer and allows users to display, query, update, and analyze data about geographic locations and the information linked to those locations. All traditional GIS tasks, i.e., not tasks related to web and remote processing applications, can be accomplished with a desktop GIS. Sometimes, proprietary GIS software vendors distinguish in software pricing between two or three categories of desktop GIS with respect to the functionality that the software offers. In the case of 3 desktop GIS categories so-called viewer applications offer functionality for viewing and exploring data, while editor applications provide, in addition to viewer capabilities, the ability to create and update spatial data. Analysis GIS software, also termed “Professional edition”, Typically offers the highest level of functionality by adding functions for data analysis, map creation, data conflation, etc., to editor applications. (DeMers, 2009).
17.3.3 Open Source GIS Software
Due to the lack of money for buying licenses one of the biggest considerations is the use of Open Source software. There are many analyzed software packages with a certified OSI Open Source License 10. The software is divided into different categories according to what it is used for. (DeMers, 2009).
17.3.3.1 OGC Spatial servers
There is a set of available software that helps to create OGC services. This software is normally installed in a web server and is configured to publish your data trough OGC standards. More specifically for our purpose we consider the following standards necessary: WMS, WFS, CSW, and WCTS.
Degree 11: free software initiative founded by the GIS and Remote Sensing unit of the Department of Geography, University of Bonn, and lat/long. It is the reference implementation for the WMS standard. With more than one single software package, degree is a set of building blocks to construct OGC services. The software is right now under a big rebuild and a new version 2.0mis expected to be released before the end of the year.
-
OGC Standards supported: WMS, WFS, WCS, WCAS, WFS-G, WTS, WCTS, and CSW.
-
Read & Write interfaces: ORACLE Spatial, PostGres/PostGIS, MySQL, other JDBC-enabled databases, ESRI Shapefiles, several raster data formats (JPEG, GIF, PNG, (Geo) TIFF, PNM und BMP).
-
Architecture: Java-servlet
17.3.3.2 Geoserver 12: again a free software initiative. It has a good community support behind and some projects funding its further development. It is the reference implementation for the WFS standard. The installation is easy and the documentation complete. Right now it only supports one feature per table and the mapping of complex schemas is not complete. There are people working on solving those limitations though.
OGC Standards supported: WMS, WFS.
Read & Write interfaces: PostGIS, ESRI Shapefile, ArcSDE and Oracle, VPF, MySQL, MapInfo, KML…
Architecture: Java-servlet
(Javier de la Torre)
17.3.3.3 Mapserver 13: Originally developed at the University of Minnesota (UMN) through the NASA-sponsored ForNet project, a cooperative effort with the Minnesota Department of Natural Resources. The software has grown and is maintained by an increasing number of developers (nearing 20) from around the world and is supported by a diverse group of organisations funding enhancements.
The project started before the creation of these OGC standards and was later adapted to support them up to a certain degree. Right now the WFS service is read only and transactions are not supported. A bigger limitation is the lack of support of filters in feature attributes and POST operations.
OGC Standards supported: WMS, non-transactional WFS, and WCS.
Read & Write interfaces: ESRI shapefiles, PostGIS, ESRI ArcSDE, TIFF/GeoTIFF, EPPL7
Architecture: CGI implemented in C, scripts in different scripting languages.
(Javier de la Torre)
17.3.4 Software Manufacturers and Projects
GIS software is not only provided by companies but increasingly also by free and open source software projects. While commercial vendors usually offer products for all of software categories, open software projects often concentrate on a single category, e.g. desktop GIS or WebMap server. The key players in the GIS software market today are Autodesk, Bentley, ESRI Inc., GE (Smallworld), Pitney Bowes (MapInfo), and Intergraph. GIS software companies tend to target specific application domains. For instance, ESRI’s ArcGIS product tends to be mainly used for business analysis, planning, and environmental applications, while Autodesk, GE and Bentley products are rather used in utility and facility management. Competitive GIS software that is developed by free software projects exists as well - especially with respect to server applications (MapServer, GeoServer) and spatial DBMS (PostGIS). Free desktop GIS projects, such as Quantum GIS and gvSIG, currently experience growing user communities. Such free GIS software rather complements the set of proprietary software instead of competing with it. (Steiniger and Weibel, 2009).
Table 17.1. Sites of proprietary software suites and to those providing programs which are shareware, or low cost, or entirely free of license. (Source: Liu and Mason, 2009)
|
Autodesk |
www.usa.autodesk.com |
|
ERDAS |
www.erdas.com |
|
ER Mapper |
www.ermapper.com |
|
ESRI |
www.esri.com |
|
FME Safe Software |
www.safe.com |
|
Geo tools |
www.geotools.codehaus.org |
|
Global Mapper |
www.globalmapper.com |
|
GRASS |
www.grass.itc.it |
|
Idrisi |
www.clarklabs.org |
|
ILWISS |
www.itc.nl/ilwis |
|
ITTVis ENVI |
www.ittvis.com/envi |
|
JUMP GIS |
www.jump-project.org |
|
Landserf |
www.landserf.org |
|
Map Window |
www.mapwindow.org |
|
MapInfo |
www.mapinfo.com |
|
PCI Geomatics |
www.pcigeomatics.com |
|
Quantum GIS opensource |
www.qgis.org |
|
SAGA GIS |
www.saga-gis.org |
|
Various independent |
www.rockware.com |
|
Variowin |
www.sst.unil.ch/research/variowin |
|
Virtuozo |
www.supresoft.com. |
Table 17.2. Information and technical information on standards, best practice, formats, techniques and various publications. (Source: Liu and Mason, 2009)
|
Association for Geographic Information (AGI) |
www.agi.org.uk |
|
British Geological Survey (BGS) |
www.bgs.ac.uk |
|
Committee on Earth Observation Satellites (CEOS) |
www.coes.cnes.fr |
|
Digital Earth |
www.dgeo.org |
|
Digital National Framework |
www.dnf.org |
|
ESRI ArcUser online |
www.esri.com/news/arcuser |
|
ESRI online knowledge base |
www.support.esri.com |
|
Geospatial Analysis online |
www.spatialanalysisonline.com |
|
Geospatial Information and Technology Association (GITA) |
www.gita.org |
|
GIS Day |
www.gisday.com |
|
GIS Research UK (GISRUK) |
www.geo.ed.ac.uk/gisruk |
|
Grid Forum 2001 |
www.gridforum.org |
|
International Association of Photogrammetry & Remote Sensing |
www.isprs.org |
|
International DEM Service |
www.cse.dmu.ac. |
|
Open Geospatial Consortium |
www.opengeospatial.org |
|
Ordnance Survey (OS) |
www.ordnancesurvey.co.uk |
|
Remote Sensing and Photogrammetry Society (RSPSoc) |
www.rspsoc.org |
|
UKGeoForum (umbrella organization) |
www.ukgeoforum.org.uk |
|
Web 3D Consortium |
www.geovrml.org |
|
World Wide Web Consortium |
www.w3.org |
Table 17.3. Data sources including online satellite imagery from major suppliers, Dem data plus GIS maps and data of all kinds. (Source: Liu and Mason, 2009)
|
ALOS data search |
www.cross.restec.or.jp |
|
Asia Pacific Natural Hazards Network |
www.pdc.org/mde/explorer.jsp |
|
Digital Globe (Quickbird & WorldView) |
www.browse.digitalglobe.com |
|
EarthExplorer |
www.earthexplorer.usgs.gov |
Table 17.4. Online resources for information, software and data. (Source: Liu and Mason, 2009)
|
ALOS data search |
www.cross.restec.or.jp |
|
EOS Data Gateway edcims |
www.cr.usgs.gov/pub/imswelcome/plain.html |
|
ESA EOLI catalogues |
www.catalogues.eoportal.org |
|
Geo Community GIS free data depot |
www.data.geocomm.com |
|
GeoEye (GeoFUSE) |
www.geofuse.geoeye.com/landing |
|
GIS data depot |
www.gisdepot.com |
|
GIS Lounge |
www.gislounge.com |
|
GLCF |
wwwlcf.umiacs.umd.edu |
|
Glovis |
www.glovis.usgs.gov |
|
SPOT catalogue |
www.sirius.spotimage.fr |
|
SRTM Public Data |
www2.jpl.nasa.gov/srtm/cbanddataproducts.html |
GIS software is a fundamental and critical part of any operational GIS. The software employed in a GIS project has a controlling impact on the type of studies that can be undertaken and the results that can be obtained. There are also far reaching implications for user productivity and project costs. Today, there are many types of GIS software product to choose from and a number of ways to configure implementations. One of the exciting andat timesunnerving characteristics of GIS software is its very rapid rate of development. This is a trend that seems set to continue as the software industry pushes ahead with significant research and development efforts.
17.4 Applications of GIS
An important distinction between GIS applications is whether the geographic phenomena studied are man-made or natural. Clearly, setting up a cadastral information system, or using GIS for urban planning purposes involves a study of man-made things mostly: the parcels, roads, sidewalks, and at larger scale, suburbs and transportation routes are all man-made, those entities often have clear-cut boundaries. On the other hand, geomorphologists, ecologists and soil scientists often have natural phenomena as their study objects. They may be looking at rock formations, plate tectonics, distribution of natural vegetation or soil units. Often, these entities do not have clear-cut boundaries, and there exist transition zones where one vegetation type, for instance, is gradually replaced by another. (de et al, 2001).
The applications of GIS include mapping locations, quantities and densities, finding distances and mapping and monitoring change. Function of an Information system is to improve one’s ability to make decisions. An Information system is a chain of operations starting from planning the observation and collection of data, to store and analysis of the data, to the use of the derived information in some decision making process. A GIS is an information system that is designed to work with data referenced to spatial or geographic coordinates. GIS is both a database system with specific capabilities for spatially referenced data, as well as a set of operation for working with data. There are three basic types of GIS applications which might also represent stages of development of a single GIS application. (ESRI White Paper, 2006).
17.4.1 Inventory Application
Many times the first step in developing a GIS application is making an inventory of the features for a given geographic area. These features are represented in GIS as layers or themes of data. The emphasis at this stage of application development consists of updating and simple data retrieval. (ESRI White Paper, 2006).
17.4.2 Analysis Application
Upon completion of the inventory stage, complex queries on multiple layers can be performed using spatial and aspatial analysis techniques. (ESRI White Paper, 2006).
17.4.3 Management Application
More advanced spatial and modeling techniques are required to support the decisions of managers and policy makers. This involves shifting of emphasis from basic geographic data handling to manipulation, analysis and modeling in order to solve real world problems.
17.4.4 Five Ms
There is, quite simply, a huge range of applications of GIS. They include topographic base mapping, socio-economic and environmental modeling, global modeling, and education. The five Ms of GIS application are Mapping, Measurement, Monitoring, Modeling, and Management.
In very general terms, GIS applications may be classified as traditional, developing, and new. Traditional GIS application fields include military, government, education and utilities. The mid-1990s saw the wide development of business uses, such as banking and financial services, transportation logistics, real estate, and market analysis. The early years of the 21st century are seeing new forward-looking application areas in small office/home office (SOHO) and personal or consumer applications, as well as applications concerned with security, intelligence, and counter-terrorism measures. This is a somewhat rough-and-ready classification, however, because the applications of some agencies (such as utilities) fall into more than one class. Many applications involve use of GIS by large numbers of people. Once GIS applications become established within an organization, usage often spreads widely. Integration of GIS with corporate information system (IS) policy and with forward planning policy is an essential prerequisite for success in many organizations.
Government and public service
Business and service planning
Logistics and transportation
Environment
(Longley, 2005)
17.4.5 Government and public service
Government users were among the first to discover the value of GIS. Today GIS is used at all levels of government from the national to the neighborhood, and government users still comprise the biggest single group of GIS professionals. As GIS has become cheaper, so it has come to be used in government decision making at all levels from the nation to the neighborhood. GIS is used to inventory resources and infrastructure, plan transportation routing, improve public service delivery, manage land development, and generate revenue by increasing economic activity. Typical GIS applications thus include monitoring public health risk, managing public housing stock, allocating welfare assistance funds, and tracking crime. It is convenient to group local government GIS applications on the basis of their contribution to asset inventory, policy analysis, and strategic modeling/planning.
(Longley, 2005)
Table 17.5. GIS applications in Local Government
|
|
Inventory Applications |
Policy Analysis Applications |
Management/ Policy Making Applications |
|
Economic development |
Location of major business and their primary resource demands |
Analysis of resource demand by potential local supplier |
Informing the availability of local suppliers |
|
Transportation and Services Routing |
Identification of sanitation, truck routes, land fill and recycling area |
Analysis of potential capacity development in certain area and accident patterns in certain sites |
Identification of ideal high density development areas based on transportation |
|
Housing |
Inventory of housing condition, status, durability and demographics |
Analysis of public support for housing by geographic area, drive time from low income areas to needed service facilities etc |
Analysis of funding for housing rehabilitation, location of related public facilities |
|
Infrastructure |
Inventory of roads, sidewalks, bridges, utilities |
Analysis of infrastructure by demographic variables such as income and population change |
Analysis to schedule maintenance and expansion |
|
Health |
Location of person with particular health problems |
Spatial, time series analysis of the spread of disease, effects of environmental condition on disease |
Analysis of possible sources of diseases |
|
Tax Maps |
Identification of ownership data by land plot |
Analysis of tax revenues by landuse within various distance from the city centre |
Projecting land revenue change due to land use change |
|
Law Enforcement |
Inventory of location of police station, crimes, arrests, patrol car routing, alarm and security system locations |
Analysis of police visibility and presence; officers in relation to density of criminal activity |
Reallocation of police resources and facilities to areas where they are likely to be most efficient and effective. |
|
Land-use planning |
Parcel inventory of zoning areas, floodplains, industrial parks, land uses, trees, green space etc |
Analysis of percentage of land used in each category, density levels by neighbourhoods, threats to residential amenities |
Evaluation of land-use plan based on demographic characteristics of nearby population |
|
Parks and Recreation |
Inventory of park holdings/playscapes, trails by type etc |
Analysis of neighbourhood access to parks and recreation opportunities, age-related proximity to relevant playscapes |
Modeling population growth projections and potential future recreational needs |
|
Environmental Monitoring |
Inventory of environmental hazards in relation to vital resources such as groundwater; layering of nonpoint pollution sources |
Analysis of spread rates and cumulative pollution level; analysis of potential years of life lost in a particular area due to hazards |
Modeling potential environmental harm to specific local areas; analysis of place- specific multilayered pollution abatement plans |
|
Emergency Management |
Location of key emergency exit routes, their traffic flow capacity and critical danger points |
Analysis of potential effects of emergencies of various magnitudes on exit routes, traffic flows etc |
Modeling effect of placing emergency facilities and response capacities in particular locations |
|
Geodemo-graphics |
Location of persons with specific demographic characteristics such as voting patterns, service usage and preferences, commuting routes occupations |
Analysis of voting characteristics of particular areas |
Modeling effect of placing information kiosks at particular locations |
Source:http://www.scribd.com/doc/55973482/Geographic-InformationSystems and-Science
17.4.6 Business and service planning
Business and service planning (sometimes called retailing) applications focus upon the use of geographic data to provide operational, tactical, and strategic context to decisions that involve the fundamental question, where? Geodemographics is a shorthand term for composite indicators of consumer behavior that are available at the small area level (e.g., census output area, or postal zone). Geodemographic data are the basis for much market area analysis.
The tools of business applications typically range from simple desktop mapping to sophisticated decision sup-port systems. Tools are used to analyze and inform the range of operational, tactical, and strategic functions of an organization. These tools may be part of standard GIS software, or they may be developed in-house by the organization, or they may be purchased as a ‘business solution’ product. Operational functions concern the day-to-day processing of routine transactions and inventory analysis in an organization, such as stock management. Tactical functions require the allocation of resources to address specific (usually short term) problems, such as store sales promotions. Strategic functions contribute to the organization’s longer-term goals and mission, and entail problems such as opening new stores or rationalizing existing store networks. Early business applications were simply concerned with mapping spatially referenced data, as a general descriptive indicator of the retail environment. This remains the first stage in most business applications, and in itself adds an important dimension to analysis of organizational function. (Longley, 2005)
17.4.7 Logistics and transportation
Knowing where things are can be of enormous importance for the fields of logistics and transportation, which deal with the movement of goods and people from one place to another and the infrastructure (highways, railroads, canals) that moves them. Logistics companies (e.g., parcel delivery companies, shipping companies) need to organize their operations, deciding where to place their central sorting warehouses and the facilities that transfer goods from one mode to another (e.g., from truck to ship), how to route parcels from origins to destinations, and how to route delivery trucks. All of these fields employ GIS, in a mixture of operational, tactical, and strategic applications.
The field of logistics addresses the shipping and transportation of goods. Each of these applications has two parts: the static part that deals with the fixed infrastructure, and the dynamic part that deals with the vehicles, goods, and people that move on the static part. Of course, not even a highway network is truly static, since highways are often rebuilt, new highways are added, and highways are even some-times moved. But the minute-to-minute timescale of vehicle movement is sharply different from the year-to-year changes in the infrastructure. Historically, GIS has been easier to apply to the static part, but recent developments in the technology are making it much more powerful as a tool to address the dynamic part as well. Today, it is possible to use GPS to track vehicles as they move around, and transit authorities increasingly use such systems to inform their users of the locations of buses and trains. (Longley, 2005)
17.4.8 Environment
GIS allows us to compare the environmental conditions prevailing in different nations. Generally, it is understood that the 21st century will see increasing proportions of the world’s population resident in cities and towns, and so understanding of the environmental impacts of urban settlements is an increasingly important focus of attention in science and policy. Researchers have used GIS to investigate and understand how urban sprawl occurs, in order to understand the environmental consequences of sprawl and to predict its future consequences. Such predictions can be based on historic patterns of growth, together with information on the locations of roads, steeply sloping land unsuitable for development, land that is otherwise protected from urban use, and other factors that encourage or restrict urban development. Each of these factors may be represented in map form, as a layer in the GIS, while specialist software can be designed to simulate the processes that drive growth. These urban growth models are examples of dynamic simulation model, or computer programs designed to simulate the operation of some part of the human or environmental system. (Longley, 2005)
17.4.9 Other Applications
GIS applications involve both natural and man-made entities. Examples are common in areas where we study the effect of human activity on the environment. Railroad construction is such an area: it may involve parcels to be reclaimed by Government; it deals with environmental impact assessment and will usually be influenced by many restrictions, such as not crossing seasonally flooded lands, and staying within inclination extremes in hilly terrain.
A second distinction in applications of GIS stems from the overall purposes of use of the system. A prototypical use of GIS is that of a research project with an explicitly defined project objective. Such projects usually have an a priori defined duration. Feasibility studies like site suitability, but also simulation studies, for instance in erosion modeling, are examples. We call all of these project-based GIS applications.
In contrast to these are institutional GIS applications. They can be characterized in various ways. The life time (duration) of these applications is either indefinite or at least not a priori defined. Their goal is usually to provide base data to others, not to address a single research issue. Good examples of this category are monitoring systems like early warning systems for food/water scarcity, or systems that keep track of weather patterns. Indeed, our El Niño example is best qualified under this heading, because the SST and WS measurements continue. Another class of examples is found in governmental agencies like national topographic surveys, cadastral organizations and national census bureaus. They see it as their task to administer (geographic) changes, and their main business is to stay up-to-date, and provide data to others, in the form of printed material such as maps or in the form of digital data. (DeMers, 2009)
17.4.9.1 Managing business activities
GIS is about business. In fact, a whole new industry of business geographic is developing because GIS can affect the bottom line, improve product quality, and provide new opportunities. Here are a few examples of how different sectors of the business world are using GIS:
17.4.9.2 Banking: GIS activities in banking and financial institutions include regulatory compliance customer prospecting, and locating new branches and ATMs.
17.4.9.3 Business locations and customer behavior: You can more effectively Fig. out where to place a business if you know your customer base’s location. The closer or more accessible you are to the people whose buying patterns match your products, the more apt you are to be successful. Businesses can also compare market share with other surrounding businesses and adjust to changing demographic conditions.
17.4.9.4 Insurance claims adjustment: GIS can perform all the typical business and marketing tasks, including identifying potential clients, and determining risk factors. And if you’re an insurance broker, imagine being able to match applications for storm and flood insurance with a map of the 100-year flood zone.
17.4.9.5 Journalism: The media, especially the television news media, use flythrough, zoom-ins, and visual overlays of maps on imagery, providing a media-rich and enticing product.
17.4.9.6 Real estate: Real estate agents, both residential and commercial, use a GIS to search for and select properties that match client needs. Some appraisers use GIS to perform mass appraisals of whole regions at the same time.
17.4.9.7 Trucking and delivery: Moving products and material is getting more expensive all the time. Minimizing route lengths reduces cost, speeds delivery times, and increases customer satisfaction. GIS has tools specifically designed to work with road and rail networks.
17.4.9.8 Planning city operations and expansion: City, county, and regional planning has long used GIS to track development, zone land parcels, assess available resources, and plan for future growth. GIS allows planners to evaluate master plans, monitor expansion and traffic patterns, predict change, monitor population, and even decide the best place to put the new government planning office. Many GIS operations across the world are called planning departments, not GIS departments. But they often use GIS as their primary tool.
17.4.9.9 Providing protection and emergency services: Police, human services, and emergency services are beginning to use GIS. Crime mappers can identify crime hot spots and move officers where needed, corrections officers can track their parolees, hospitals can be placed where they meet the most need, and dispatchers can route emergency services (such as ambulance and fire) to their destinations — all with the power of GIS.
17.4.9.10 Land management and conservation: The first major implementation of GIS managed the enormous expanse of Canada’s natural and mineral resources. In this and similar applications, the software can help monitor fires and dispatch firefighters, monitor and manage disease and insect outbreaks, control land use and land inventory, select set asides and easements, track and manage wildlife, plan for ecotourism, and much more. Combined with today’s expanding complement of Earth-sensing satellites, the role of GIS in land management is sure to continue to expand.
17.4.9.11 Military and defense-related tasks: The military and intelligence communities are taking advantage of the GIS toolkit, which includes tools specifically targeted to those users. By combining top-secret satellite data and visual evaluation from unmanned aerial vehicles (UAVs) with the power of GIS and existing datasets, defense departments can evaluate troop movements, target artillery fire, test scenarios, perform supply and logistics operations, and monitor borders. The military and intelligence communities often rely on the same geospatial tools available to the general public — but they have exclusive access to certain data and data sources, as well as some additional and quite sophisticated software. (DeMers, 2009)
17.4.9.12 Uses Of Coastal GIS Packages
1. Retrieval of information of any specific site.
2. Provision of summary data for planning purpose.
3. Graphical display for educational and public relation exercise.
4. Classification of coasts and management zone.
5. Predicting modeling to determine.
A. Projections of coastal changes.
B. Impacts of individual schemes.
C. Impacts from changes of use.
D. Impacts from natural calamities.
(ESRI White Paper, 2006)
17.4.9.13 GIS for Fire Prevention
Wildfire prevention efforts can be focused where wildfires pose the greatest risk of resource loss. When intense fire areas (highly flammable landscapes) exist near high-risk areas (ignition sources) and high values, fire prevention becomes critical. Historical fire information can be viewed with all the other landscape information. Fire prevention officers can begin to determine an appropriate program strategy. This fire prevention strategy may be one of education, enforcement, or engineering, depending on the type of land use and historical fire causes. As housing development continues to expand and encroach into wooded and brush-covered areas, it becomes fire prone. The "urban interface" requires extensive fire prevention and fire protection measures. GIS can model and display potential fire prevention/protection strategies. (Ramachandran, 2005)
17.4.9.14 GIS for Vegetation Management
Landscapes that require vegetation management treatments (e.g., prescribed fire, mechanical treatments) will stand out when using GIS. Landscapes with high flammability characteristics (high hazard, high risk, and high value) become obvious candidates for vegetation or fuel treatment programs. GIS technology allows fire managers to identify prescribed fire and vegetation management projects with the highest benefit (meeting multiple goals for resource and fire management). Vegetation management tactics can include mechanical, chemical, or prescribed burning techniques. GIS can assist in modeling how a fire will behave and spread under a variety of conditions to assist in developing fire prescriptions. (Ramachandran, 2005)
17.4.9.15 Education and Training
GIS is beneficial for education and training. Wildfire management personnel require several years of experience and training to become proficient. GIS provides access to detailed landscape information during wildfire events. Fire personnel begin to understand the complexities, fire effects, and fire behavior characteristics of various wildfires much sooner when using GIS. Modeling provides a better understanding of what a fire might do and what elements influence the wildfire most. Wildfire knowledge has traditionally been gained through years of experience, formal training, and discussions with experienced fire personnel. GIS is now another resource fire personnel can use to expand their understanding of the variables and complexities that affect wildfires. As modeling becomes more precise, dispatchers will be able to determine the potential of new starts and possible dispatch requirements.
GIS is a vital tool for wildfire information management. GIS is a primary repository of information that can be quickly accessed and viewed when required. GIS is becoming more suitable for emergency field operation use and is integrating tools that allow real-time display of information. Rapid access to information, safety, efficiency, and better resource management decisions are being made with the use of GIS for wildfire management. Information is critical for wild land fire management. GIS is information, all in one place, easy to visualize and understand.
(Ramachandran, 2005)
Keywords: GIS Workflow, Database Management System (DBMS), GIS packages, Open-Source GIS, Applications of GIS.
References
Blasby, D., Davis, M., Kim, D. and Ramsey, P. (2002). GIS Conflation using Open Source Tools, A white paper, pp.3-4.
de By R.A, Knippers R.A, Sun Y, Ellis M.C, Kraak M.J, Weir M.J.C, Georgiadou Y, Radwan M.M, Westen C.J, Kainz W and Sides E.J. (2001) Principles of Geographical Information Systems, ITC, (43-44).
DeMers N.M (2009) GIS for Dummies, Wiley Publishing, pp. 20-22 and pp.315.
ESRI White Paper (2006) GIS Technology and Applications for the Fire Service
http://gis.nic.in/gisprimer/dbms.html
http://gisserver.civil.iitd.ac.in/gislab/Lecture/Lecture%2001_Introduction%20to%20GIS.pdf
http://www.geog.ubc.ca/courses/klink/gis.notes/ncgia/u01.html#SEC1.2
Hunter, A.J.S and Steiniger, S. (2012), The 2012 Free and Open source GIS Software Map – A Guide to facilitate Research, Development and Adoption, Computers, Environment and Urban Systems.
Javier de la Torre, Report of existing GIS standards and software – Deliverable 3.6.1, Synthesys NA- D 3.6.
Johnson, E.L. (2009). Geographic Information Systems in Water Resources Engineering, CRC Press, pp. 18.
Liu, J.G. and Mason, P.J. (2009). Essential Image Processing and GIS for Remote Sensing, John Wiley & Sons Ltd, pp.424.
Longley P.A, Goodchild M.F, Maguire J.D, and Rhind W.D. (2005) Geographic Information Systems and Science, John Wiley & Sons Ltd, 2(170-175) and 2(36-60).
Steiniger, S. and Weibel, R. (2009). GIS Software – A description in 1000 words, University of Calgary, University of Zurich.
Last modified: Monday, 27 January 2014, 10:24 AM