Site pages
Current course
Participants
General
Module 1: Introduction and Concepts of Remote Sensing
Module 2: Sensors, Platforms and Tracking System
Module 3: Fundamentals of Aerial Photography
Module 4: Digital Image Processing
Module 5: Microwave and Radar System
Module 6: Geographic Information Systems (GIS)
Module 7: Data Models and Structures
Module 8: Map Projections and Datum
Module 9: Operations on Spatial Data
Module 10: Fundamentals of Global Positioning System
Lesson 18 Data Models
A data model describes in an abstract way how data is represented in an information system or in a database management system. It is also a description of structural properties that define all entities represented in the database, and all the relationships that exist among them. The manner in which data is generally organized in the database management system is sometimes also called as database model. A database model is a theory or specification describing how database is structured and used (also called data structure). Several such models have been suggested. Common model include hierarchical model, network model, relational model, entity-relationship model and object oriented model.
A data model aims to identify and organize the required data logically and physically, used as part of a database design phase. A model provides attributes of a data element and also the relationship between them. Study of data model is necessary to understand the data in a better way.
Maps may be represented by several GIS data models such as raster, vector, etc. knowledge about the data models of GIS is important because it provides us information on how data are stored on the computer and their representation. Depending on the GIS data model and representation, the way in which our analysis is done and result obtained may be different (Bhatia, 2010).
18.1 Spatial Data
Data that describe a part of the Earth’s surface or the features found on it could be described as geographical ‘spatial’ data. It includes cartographic and scientific data with photographs, videos, land records, travel information, customer databases, property records, legal documents and so on. Another term used, Features in reference to objects, located at the surface of the Earth, whose positions have been measured and described. Features may be naturally occurring objects or anthropogenic constructions and classifications. Features appearing on the map are stored as separate entities which have other intelligence stored with them as ‘attributes’ (Jian et al, 2009).
18.1.1 Spatial Data Model
The real world too complex for our immediate and direct understanding, so we create models or abstractions of reality that are intended to have some similarity with selected aspects of real world. A spatial database is a collection of spatially referenced data that act as model of reality.
There are two types of data models used for spatial data:
(A) Conceptual data models: It organizes principles that translate the real world into functional descriptions of how phenomena are represented and related to one another.
Objects: Objects with discrete boundaries represented by geometric features.
Fields: continuous phenomena such as elevation, temperature and soil chemistry; they exists everywhere (every point has an elevation or temperature); they are not discrete entities.
Spatial feature may be discrete (objects) or continuous (fields). Discrete features are those that do not exist between observations, those that form separate entities, and are individually distinguishable. Roads, buildings, water bodies, etc. are the examples of continuous features.
(B) Logical data models: It provides the explicit forms, which the conceptual model can take.
Raster: A grid of cells or pixels.
Vector: Objects are represented as geometric entities, including points, spaghetti lines, arc/node lines, networked lines with directionally, whole polygons, and topological polygons. Continuous fields may be also represented by vector such as triangular irregular network (TINs).
Object oriented: Real-world objects are used as basis for abstraction, instead of geometric objects such as points lines and polygons.
Understanding the type of data model by which particular dataset is created and stored is important, since the type of functions or transformations that can be performed on the data is dependent on how it is represented and organized. The logical data model should not only describe how data is represented, but it should also describe entities of features are related to one another (Bhatia, 2010).
18.1.2 Spatial Data File:
1) Spatial data files are somewhat like other files you work with on a computer. They can be:
a) stored on a hard drive, memory stick, CD, DVD
b) Assigned either a user-defined file name, or are given default file name by a software application
c) Organized into folders
d) Have the ability to be opened, viewed and edited by one or more GIS software applications that understand their format.
2) However, that is where the similarities end. Spatial data files are unique in that they store “georeferenced” information – information that defines location or place. In addition, descriptive information about the georeferenced information is stored in each spatial data file.
3) Thus rather than just text (like a word processing document) or numbers (like a spreadsheet), an individual spatial data file is a digital representation of a similar group of geographic features on the surface of the earth (or any other planetary body!).
4) The geographic features can be actual physical entities or events, or they can represent conceptual features.
5) Examples of individual spatial data files representing real geographic features or events are lakes, rivers, wetlands, elevation contours, roads, forested areas, rare species habitats, soils, earthquakes, vehicle thefts, electricity distribution lines, and groundwater reservoirs.
6) Examples of individual spatial data files representing conceptual geographic features are census tract boundaries, zoning boundaries, or parcel boundaries (i.e. conceptual features do not physically exist on the landscape, but are imposed by us for various reasons and can be represented in a geographic context).
7) Each spatial data file is uniquely constructed to work within GIS software applications. Each one consists of unique characteristics:
a) “Shapes” that attempt to reflect / convey the appearance and position of individual geographic features as accurately as possible.
b) Records within a related tabular database that contain numeric and/or textual descriptions of each feature.
c) A coordinate system that defines the true location of all the features on the earth’s surface (i.e. the latitude/longitude).
18.1.3 Formats of Spatial Data Files
Spatial data files come in several different formats. You may need to use only one, or you may need to use a combination of them, depending on your particular application and/or type of analysis. Each format falls under one of two different categories: vector or raster.
Vector spatial data files are ones in which the geographic features being represented are built by a collection of vertices and lines.
Raster spatial data files are ones in which the geographic features across an entire area are represented by a continuous set of “pixels” or “cells”.
1. The Shapefile spatial data file format
a) This is a very common format for spatial data files in the vector category.
b) In this format, geographic features can be represented in one of three ways:
i) Points
ii) Lines (aka arcs)
iii) Polygons (aka areas, polylines
2. The Coverage spatial data file format
a) This was the original spatial data file format used in GIS software. While this format has taken a “backseat” to the shapefile format due to the simplicity of shapefiles, coverages are still very viable and have many advantages.
b) Along with shapefiles, the coverage format is being superseded by the new geodatabase format (see below).
c) However, many web sites still offer spatial data for download in the coverage format, so you should at least know that they exist, and know a little bit about their structure in the event you need to use one.
d) Just like shapefiles, geographic features are represented as points, lines, or polygons and many factors come into play when deciding which representation is best (see B-1-c above). Coverages also fall within the vector category.
e) Unlike shapefiles, a single coverage is actually comprised of two folders. Each folder contains a multitude of other files that the GIS software “puts together” in order to represent geographic features and associated tabular information when it is opened.
f) If either folder is missing, or if files from within either folder are missing, the coverage will be “corrupt” and not useable.
g) Coverages and shapefiles are often used almost interchangeably in GIS. They each can represent the same geographic features. It is only the internal file structure that is different. An analogy would be a Microsoft Word document vs. a Corel Word Perfect document. Both files are used to contain text (primarily) and you can import and export them at will, but they have different underlying structures which are, most of the time, invisible to you. Similarly, coverages and shapefiles are both used to contain geographic data of the vector type. It is possible to convert a shapefile to a coverage and vice-versa.
3. The Grid spatial data file format
a) In most respects, grids are very different from either shapefiles or coverages. Grids fall into the raster category; they are constructed of rows and columns of pixels instead of vertices and arcs.
b) Like coverages however, grids are comprised of two folders, each containing files that the software “puts together” for display and manipulation
c) Grids can be either:
i) Integer Grids – in this case, the pixel values are integers and each integer may also be associated with one or more textual descriptions.
ii) Floating Point Grids – in this case, the pixel values will be expressed as decimals. Floating point grids cannot have textual descriptions.
4. Images as Spatial Data Files
a) Many different image formats can be used in GIS. Some of these may be more familiar than others: .jpg, .tif, .bil, .png, .img, .sid
b) All image formats fall within the raster category of spatial data.
c) In some cases, images are not used specifically as “spatial data”, but are used to enhance spatial data by providing a digital photograph of a place or object. For example, a shapefile representing all land parcels within a city may have links to digital photographs of each house on each parcel.
d) In other cases, the images themselves are spatial data. Data provided from the Landsat satellite is an example of imagery that is spatial. If you have ever used Google Earth, the images that appear when you zoom in are spatial data.
e) When an image is “georeferenced” - meaning that information is embedded within the image that describes its position on the surface of the earth in real world coordinates (Latitude/longitude) – It becomes spatial data.
e) In addition to being “georeferenced”, many images may also be “orthorectified”. This term refers to a complex process wherein distortions caused by differences in terrain, camera tilt, and edge effects are removed from the image. Images that are both georeferenced and ortho rectified are frequently called “orthophotographs” or just “Orthos” for short (http://gisatbrown.typepad.com/gis/files/spatialdatafiles.pdf).
18.2 Attributes and Measurement Scales
Descriptive attributes can also be described as being spatial or non-spatial, though the difference between them may be subtle and ambiguous. The nature of the information stored, or rather the scale of measurement to which they belong, dictates what kind of processing or analysis can be performed with them. Measurement scales describe how values are assigned to features and objects represented in GIS. The type of scale chosen is dictated by the intended use of the recorded information. There are five scales commonly used in GIS, namely nominal, ordinal, interval, and ratio and cyclic, and these are summarized, along with the numerical operators appropriate to each case, in Table 18.1 (Jian et al, 2009).
Nominal data are discrete (i.e., mutually exclusive) and are classed according to type or quality. For example, a line could represent either a road or river, and a land use polygon could be residential, commercial, or a recreational area. Nominal data are often labeled with numbers or letters, but these labels do not imply ranking. A nominal datum can only be examined for its physical similarity to, or its difference from, other occurrences, or for the frequency of its occurrence (http://www.rain.org/gis/map-classroom/maps-symbols-for-maps.html). Nominal or categorical scales include numerical values used to represent real-world objects or qualitative descriptions. They can be used as ‘pointers’ to other descriptive (textual) information held in attribute tables (Jian et al, 2009).
Ordinal data provide information about rank or hierarchy, in other words, relative values. Therefore, it is possible to describe one item as larger or smaller than another, or as low, medium or high. However, it is not possible to measure the differences between ordinal data, because there are no specific numerical values attached to them. An example of ordinal data is roads ranked as expressway, main thoroughfare, and secondary road (http://www.rain.org/gis/map-classroom/maps-symbols-for-maps.html). Ordinal measures involve values ranked or ordered according to a relative scale and which generally have unequal intervals. Greater than or less than operators are therefore useful but addition, subtraction, multiplication and division are not appropriate. One example is multi-element geochemical data where element concentrations are given on a percentile scale and the intervals between classes are not constant but arbitrary (Jian et al, 2009).
|
Scale |
Operators |
Examples |
|
Nominal |
=,≠ and mode |
Categorical (class) identifiers (e.g. 5=forest, 4=pasture,9= urban) |
|
Ordinal |
<,≤, ≥,> and median |
Sequences of natural order, for example 1, 2, 3, 4 |
|
Interval |
+, -, ×, ÷ and mean |
Ranges between, and sections along, distance measures, for example temperature scales |
|
Ratio |
All the above |
Distance measures, and subdivisions thereof, along lines and routes |
|
Cyclic |
All the above |
Special measures, for example 360_ bearings (azimuth), flow directions |
Table 18.1 Measurement of scale: methods for describing and operating on thematic information
(Source: Jian et al, 2009)
Interval data, in addition to being ranked, include numerical values. The information can be arranged along a scale using a standard unit. Therefore, it is possible to calculate the distance or difference between ranks, which must be expressed in terms of a standard unit (http://www.rain.org/gis/map-classroom/maps-symbols-for-maps.html). Interval measures are used to denote quantities like distances or ranges but in this case the intervals between the values are based on equal or regular units. There is, however, no true zero on an interval scale because the position of zero depends on the units of the quantity being described. Temperature scales are a good example because the position of zero temperature depends on the units of measurement, Fahrenheit or Celsius (Jian et al, 2009).
Ratio data are the same as interval data, except there is a natural zero; therefore, it is possible to express data as ratios. Physical measurements of height, weight, and length are examples of ratio variables. With this type of data it is meaningful to state that a measurement is twice that of another. This ratio remains true no matter what the unit of measurement (e.g., meters or feet) because this type of data has a natural zero. A natural zero is a non-arbitrary starting point for data. For example, a measurement of distance at zero units has no length; furthermore, it makes sense to state that two metres are twice as long as one metre. Whereas, with the measurement of time, the year zero is arbitrary, so it is not sensible to state that the year 2000 is twice as old as the year 1000 (http://www.rain.org/gis/map-classroom/maps-symbols-for-maps.html).
Ratio measures are similar to interval scales and are often used for distances or quantities but the zero value represents absolute zero, regardless of the units.
Cyclic measures are a special case describing quantities which are measured on regular scales but which are circular or cyclic in their framework, such as aspect or azimuth directions of slopes, or flow directions, both of which are angular measures made with respect to north. Appropriate operators are then any or all of the previously mentioned arithmetic and average operators (Jian et al, 2009).
18.2.1 Data structures
There are two basic types of structures used to represent the features or objects, namely raster and vector data, and as a consequence of this split, there are different types of GIS software, and different types of analysis, which have been designed in such a way as to be effective with one or the other type (Jian et al, 2009).
In its simplest form, a raster consists of a matrix of cells (or pixels) organized into rows and columns (or a grid) where each cell contains a value representing information, such as temperature. Rasters are digital aerial photographs, imagery from satellites, digital pictures, or even scanned maps.

Fig. 18.1. Raster data structures.
(Source: http://webhelp.esri.com/arcgisdesktop/9.2/index.cfm?TopicName=What_is_raster_data%3F)
Data stored in a raster format represents real-world phenomena, such as:
Thematic data (also known as discrete), representing features such as land-use or soils data
Continuous data, representing phenomena such as temperature, elevation or spectral data such as satellite images and aerial photographs
Pictures, such as scanned maps or drawings and building photographs
Thematic and continuous rasters may be displayed as data layers along with other geographic data on your map but are often used as the source data for spatial analysis with the ArcGIS Spatial Analyst extension. Picture rasters are often used as attributes in tables—they can be displayed with your geographic data and are used to convey additional information about map features.
While the structure of raster data is simple, it is exceptionally useful for a wide range of applications. Within a GIS, the uses of raster data fall under four main categories.
(1) Raster as a base map
A common use of raster data in a GIS is as a background display for other feature layers. For example, orthophotographs displayed underneath other layers provide the map user with confidence that map layers are spatially aligned and represent real objects, as well as representing additional information.
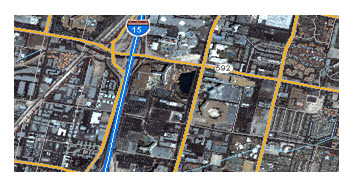
Fig. 18.2. Rasters as base maps.
(http://webhelp.esri.com/arcgisdesktop/9.2/index.cfm?TopicName=What_is_raster_data %3F)
(2) Rasters as surface maps
Rasters are well suited for representing data that changes continuously across a landscape (surface). They provide an effective method of storing the continuity as a surface. They also provide a regularly spaced representation of surfaces. Elevation values measured from the earth's surface are the most common application of surface maps, but other values, such as rainfall, temperature, concentration, and population density, can also define surfaces that can be spatially analyzed. The raster below displays elevation using green to show lower elevation and red, pink and white cells to show higher elevation.
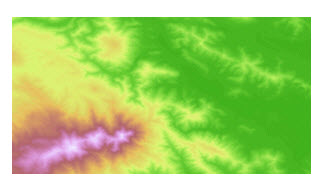
Fig. 18.3. Raster as a surface map.
(Source: http://webhelp.esri.com/arcgisdesktop/9.2/index.cfm?TopicName=What_is_raster_data%3F)
(3) Rasters as thematic maps
Rasters representing thematic data can be derived from analyzing other data. A common analysis application is classifying a satellite image by land-cover categories. Basically, this activity groups the values of multispectral data into classes (such as vegetation type) and assigns a categorical value. Thematic maps can also result from geoprocessing operations that combine data from various sources, such as vector, raster, and terrain data. For example, you can process data through a geoprocessing model to create a raster dataset that maps suitability for a specific activity.
Below is an example of a classified raster dataset showing land use.
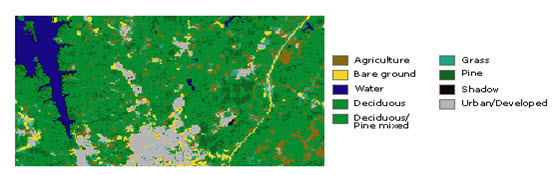
Fig. 18.4. Raster as a thematic map.
(Source: http://webhelp.esri.com/arcgisdesktop/9.2/index.cfm?TopicName=What_is_raster_data%3F)
(4) Rasters as attributes of a feature
Rasters used as attributes of a feature may be digital photographs, scanned documents, or scanned drawings related to a geographic object or location. A parcel layer may have scanned legal documents identifying the latest transaction for that parcel, or a layer representing cave openings may have pictures of the actual cave openings associated with the point features. Below is a digital picture of a very large, old tree that could be used as an attribute to a landscape layer that a city may maintain.
Vector data provide a way to represent real world features within the GIS environment. A feature is anything you can see on the landscape. Imagine you are standing on the top of a hill. Looking down you can see houses, roads, trees, rivers, and so on. Each one of these things would be a feature when we represent them in a GIS Application. Vector features have attributes, which consist of text or numerical information that describe the features.
A point symbol represents a geographic feature or event characterized by location and attributes. Its location can be represented by a single "x, y" coordinate pair, while attributes can be many. For example, a populated place or a mine site can be represented by a point symbol.
A line symbol represents a geographic feature characterized by linear dimension, but not area. In digital technology, a line is a sequence or stream of point coordinates with a node at each end (vector data) that symbolizes a linear feature such as a road, river, or boundary.
An area symbol represents a closed geographic surface feature, two-dimensional geometric region, or a polygon. A census division, a lake, or a province (any geographically defined surface) is examples of area features.
Rasters, images or grids consist of a regular array of digital numbers or DNs, representing picture elements or which are usually square. The basic unit of such data is the pixel, or grid cell, such that points, lines and areas are represented in raster form as individual or groups of pixels. Vector or discrete data store the geometric form and location of a particular feature, along with its attribute information describing what the feature represents. Vector data typically resemble cartographic data. Points and pixels represent discrete geographic features of no or limited area, or which are too small to be depicted in any other way, such as well locations, geochemical sample points, towns or topographic spot heights. Lines are linear features consisting of connected positions which do not in themselves represent area, such as roads, rivers, railways or elevation contours. Areas are closed features that represent the shape, area and location of homogeneous features such as countries, land parcels, buildings, rock types or land-use categories.
A surface describes a variable which has a value for every position within the extent of the dataset, such as elevation or rainfall intensity, and implies data of a ‘continuous’ nature. Surfaces are typically represented on conventional cartographic maps as a series of isolines or contours; within GIS there are other possibilities. Deciding how these features should be stored in the database, and represented on the map, depends on the nature of that information and the work it will be required to do.
The two most basic components of GIS are therefore the pixel and the point. Every other, more complex, structure in GIS stems from, and depends on, one or other of these two basic structures. GIS operations and spatial analysis can be performed on either type of data, but that analysis will be performed slightly differently as a result of this difference. We will now describe these structures in turn (http://webhelp.esri.com/arcgisdesktop/9.2/index.cfm?TopicName=What_is_raster_data%3F).
Keywords: Spatial Data Model, Data structures, Formats of Spatial Data Files, Raster, Vector.
References
Bhatia B., Remote Sensing and GIS, Oxford University Press (2010); 455-458
Jian, Guo Liu, Philippa, J. Mason, Essential Image Processing and GIS for Remote Sensing, John Wiley & Sons, Ltd (2009); 141-143
http://gisatbrown.typepad.com/gis/files/spatialdatafiles.pdf
http://www.rain.org/gis/map-classroom/maps-symbols-for-maps.html
http://webhelp.esri.com/arcgisdesktop/9.2/index.cfm?TopicName=What_is_raster_data %3F
Suggested Reading
http://www.mcc.cmu.ac.th/mccwwwthai/graduate/ags722/Attribute%20Data.pdf
http://ocw.tufts.edu/data/54/676127.pdf
http://www.fas.org/sgp/crs/misc/R40625.pdf
Last modified: Friday, 31 January 2014, 5:20 AM