Site pages
Current course
Participants
General
Module.1 Introduction of Water Resources and Hydro...
Module.2 Precipitation
Module.3 Hydrological Abstractions
Moule.4 Types and Geomorphology of Watersheds
Module 5. Runoff
Module 6. Hydrograph
Module 7. Flood Routing
Module 8. rought and Flood Management
19 April - 25 April
26 April - 2 May
Lesson 5 Rainfall Measurement
5.1 Introduction
Mostly estimates of runoff are made based on rainfall data, amount and intensity of rainfall should be known by measurement. Rainfall data is also required for calculating irrigation requirements.
5.1.1 Raingage: The purpose of the raingage is to measure the depth and intensity of rain falling on a flat surface without considering infiltration, runoff or evaporation. The problems of measurements include effects of topography, nearby vegetation and the design of gage itself.
5.2 Types of Raingages: There are mainly two types of raingages (non-recording and recording).
5.2.1 Non-recording Gage
The standard raingage, known as Symon’s gage is recommended and installed by the Indian Meteorological Department. This is a vertical, cylindrical container with top opening 127 cm in diameter. A funnel shaped hood is inserted to minimize evaporation losses. The water is funneled into an inner cylinder.
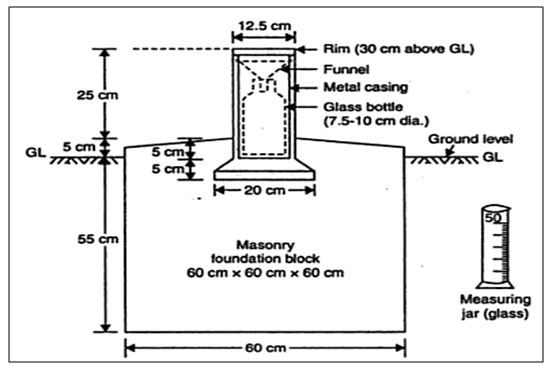
Fig. 5.1.Symon’sRaingage. (Source: Raghunath, 2006)
Considerations for Installation
-
The site should be an open place,
-
The distance between the raingage and the nearest object should be at least twice the height of the object,
-
As for as possible it should be a level ground,
-
In the hills, the site should be so chosen where it is best shielded from high winds and wind does not cause eddies, and
-
If a fence is erected, it should be atleast at a distance of twice the height.
5.2.2 Recording or Automatic Raingage
5.2.2.1 Weighting Bucket Type Raingage - This gage weighs the rain, which falls into a bucket set on a platform of a spring or level balance. The increasing weight of bucket and its counts are recorded on the chart held by a clock driven drum. The record shows the accumulation of precipitation with time in the shape of a mass curve of precipitation. The gage must be serviced about once a week when the clock is re-wound and the chart is replaced. For high rainfall, the recording mechanism reverses the direction of record immediately on reaching the upper edge of the recording chart.
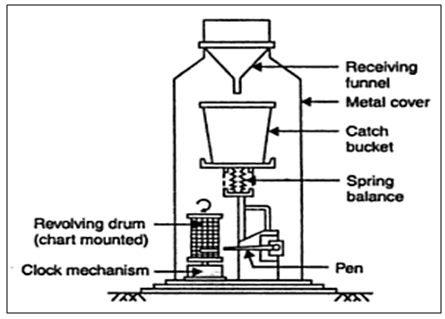
Fig. 5.2.Weighing bucket type rain gauge.(Source: Raghunath,2006)
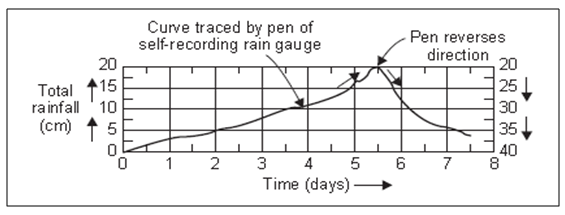
Fig. 5.3.Recorded mass curve of precipitation in weighing bucket type rain gage.(Source: Raghunath, 2006)
5.2.2.2 Tipping Bucket Type Raingage - The tipping bucket raingage consists of a 30 cm diasharp edge receiver. At the end of the receiver a funnel is provided. A pair of buckets are pivoted under the funnel in such a way that when one bucket receives 0.25 mm of rainfall it tips, discharging its contents in to a tank bringing the other bucket under the funnel. Tipping of the bucket completes an electric circuit causing the movement of a pen to mark on a clock driven revolving drum which carries a record sheet.
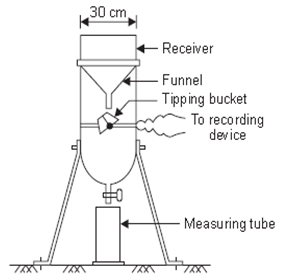
Fig. 5.4. Tipping bucket type raingage.(Source: Raghunath, 2006)
a. Siphon Type Automatic Rainfall Recorder - In the siphon gage, also known as the float type of recording raingage, the rain is fed into a float chamber containing a light, hallow float. The vertical movement of the float, as the level of water rises, is transmitted by a suitable mechanism in to the movement of the pen on a revolving chart. By suitably adjusting the dimensions of the receiving funnel, float and float chamber, any desired scale value on the chart can be obtained. Siphoning arrangement is provided for emptying the float chamber quickly whenever it becomes full, the pen returns to the bottom of the chart.
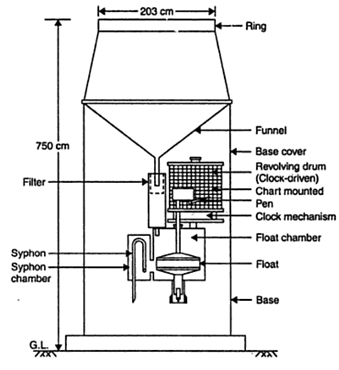
Fig. 5.5.Siphon type automatic rainfall recorder.
(Source: Raghunath, 2006)
5.3 Errors in Rainfall Measurements
There are three main sources of errors in rainfall measurements –
a) instrumental defects,
b) improper sitting (location) of the gage, and
c) human errors
Each recording type gage has inherent errors caused by mechanical parts of the instrument. In addition to mechanical errors, some precipitation is also lost in wetting the collecting funnel and measuring cylinder surface if the gage is dry before it begins to collect measurable amount of water (approximately 25 mm per year). Similarly, evaporation from a non-recording gage could cause a small loss of measurable water over the year.
The improper location of the raingage can tend to either over- or under-catch rainfall. The largest errors in all gages are the effect of wind on the entrance of rain or snow into the instrument. Errors due to wind are greater for light rain than for heavy rains.
In order to avoid erroneous conclusions it is important to give the proper interpretation to precipitation data, which often cannot be accepted at face value. For example, a mean annual precipitation value for a station may have little significance if the gage site has been changed significantly during the period for which average is computed. Also, there are several ways of computing average precipitation over an area; each may give a different answer.
5.4 Raingage Network
There is no single answer to determining the mean areal rainfall because it is affected by so many factors. However, the denser the gage network, the more accurate is the representation. Gages are not evenly spaced, high variability areas have more gages and relatively uniform rainfall areas have fewer gages. In addition, costs of installation, maintenance of the network, as well as its accessibility to the observer, are also important consideration.
In general, the sampling errors of rainfall tends to increase with increasing mean areal rainfall, and decrease with increasing network density, duration of rainfall, and areal extend. Accordingly, larger average errors are produced by a particular network for storm rainfall than for monthly, seasonal or annual rainfall.
The adequacy of an existing rain-gage network of a watershed is assessed statistically. The optimum number of raingages corresponding to an assigned percentage of error in estimation of mean areal rainfall can be obtained as:
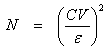 (5.1)
(5.1)
Where, N is the optimum number of raingages, CV is the coefficient of variation of the rainfall values of the gages, and is the assigned percentage of error in estimation of mean areal rainfall.
![]() (5.2)
(5.2)
In which is the mean rainfall defined as
 (5.3)
(5.3)
and S is the standard deviation of rainfall computed as
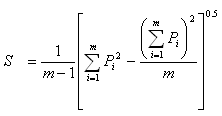 (5.4)
(5.4)
Where, m is the number of raingages in the watershed recording P1, P2… Pm values of rainfall for fixed time interval. Generally, value of is taken as 10%.
Example: A catchment has six raingage stations. In a year, the annual rainfalls recorded by the gages are as follows:
Stations A B C D E F
Rainfall (cm) 82.6 102.9 180.3 110.3 98.8 136.7
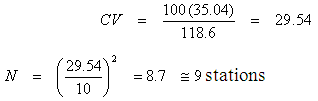
For a 10% error in the estimation of mean rainfall, calculate optimum number of stations in the catchment.
Solution: Number of stations (m) = 6,
Mean precipitation = 118.6 cm
Standard deviation of precipitation (S) = 35.04
Error (ε) = 10%
5.4.1 WMO Recommended Precipitation Network Density
-
One station per 600 to 900 km2 – in flat regions of temperate, Mediterranean and tropical zone.
-
One station per 100 to 250 km2 – in mountainous regions of temperate, Mediterranean and tropical zone.
-
One station per 25 km2 – in small mountainous land with irregular precipitation.
-
One station per 1500 to 10,000 km2 – arid and polar zones.
5.4.2 Indian Standard Recommendation
-
One station per 520 km2 –in plains.
-
One station per 260-390 km2– in regions of average elevation of 1000 m.
-
One station per 130 km2 – in predominantly hilly areas with heavy rainfall.
References
Singh, V. P. (1994). Elementary Hydrology. Prentice Hall of India Private Limited, 174-175.
Raghunath, H.M. (2006). Hydrology. New Age International (P) Ltd., 18-21.
Subramanya, K. (2006). Engineering Hydrology. Tata McGraw-Hill publishing Company Limited, 28-30.
Suggested Reading
Murty, V.V.N. and Jha, M.K. (2009).Land and Water Management Engineering.Fifth edition, Kalyani Publishers, Ludhiana.
Suresh R. (2007). Soil and Water Conservation Engineering. Fourth edition, Standard Publishers Distributors, New Delhi.
Last modified: Saturday, 1 March 2014, 11:19 AM