Site pages
Current course
Participants
General
Module 1. History and types of greenhouse
Module 2.Function and features of greenhouse
Module 3.Scope and development of greenhouse techn...
Module 4.Location, planning and various components...
Module 5.Design criteria and calculations
Module 6. Construction materials and methods of co...
Module 7. Covering material and characteristics
Module 8. Solar heat transfer
Module 9. Solar fraction for greenhouse
Module 10. Steady state analysis of greenhouse
Module No. 11 Greenhouse Heating, Cooling, Sheddin...
Module 12. Carbon dioxide generation and monitorin...
Module 13. Instrumentation and & computerized ...
Module 14. Watering, fertilization, root substrate...
Module 15. Containers and benches
Module 16. Plant nutrition, Alternative cropping s...
Module 17. Plant tissue culture
Module 18. Chemical growth regulation
Module 19. Disease control, integrated pest manage...
Module 20: Post Production Quality and Handling
Module 21: Cost analysis of greenhouse Production
Module 22. Application of greenhouse & its rep...
Lesson-20 Portable Instruments to Control the Greenhouse Environment
20.1 INTRODUCTION
“Measurement of environmental conditions accurately” is a basic key technique to understand the crop performance in greenhouse. Technology development of instrumentation (sensing, recording, and controlling) has contributed to expanding what we can do in controlled environment agriculture. This chapter deals with the portable, hand held, field quality instruments commonly used to diagnose greenhouse environment.
20.2 TEMPERATURE
Air temperature can be measured with a common thermometer. A thermometer indicates the temperature of the exposed sensor tip, or bulb, which has reached equilibrium with the surrounding environment. The sensor tip must not be exposed to radiant energy, such as from direct sunlight or a heating system radiator, as this will increase the sensor tip temperature. In that case, the measurement taken would not be representative of the surrounding air temperature. An aspirated box is recommended for shielding permanently installed greenhouse sensors from solar heat gain. Be sure that the temperature you measured is representative of the air in the area directly surrounding the plants.
A simple maximum-minimum thermometer(fig 20.2.1) that can be left in the area of interest is an inexpensive tool that can help determine whether wide temperature swings occur over a period of time. Digital thermometers are becoming more common. They are easier to read, offer remote sensing capabilities in hard-to-reach areas, and sometimes have data logging capabilities. However, digital readouts may offer a false sense of accuracy. For example, some sensors have an accuracy of ±3 percent, yet the readout displays temperature to an astonishing resolution of one-tenth of a degree.
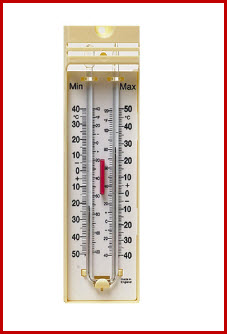
Fig 20.2.1 Maximum - Minimum thermometer
(Source: www.rapidonline.com )
20.2.1 Surface Temperature
In cases where large differences in temperature exist between greenhouse plants and surrounding surfaces such as walls, glazing, and floor, the radiant temperature of those surfaces can influence the effective plant temperature. Surface temperatures are often ignored in environmental analyses but can have a significant impact on plants. For example, the hot air volume near the roof of
the greenhouse can provide a large radiant load on the plants below. On the other hand, very cold surrounding surfaces can chill plants even though the surrounding air temperature seems adequate. Even a surface outside the structure can cause heat or cold stress if the plants can “see” it. For example, the black sky during a clear, cold winter night can cause the plants to radiate enough energy through the greenhouse structure to induce severe cold stress. These examples of radiant load would not be detected by an aspirated, dry-bulb thermometer.
Radiation is a very strong form of heat transfer, yet is purely a surface phenomenon that can be characterized by the surface temperatures of the objects radiating to each other. An object must “see” another surface in order to feel its radiant heat transfer effect. “Line-of-sight” is a straight, unobstructed pathway where radiant energy wavelengths can travel. Temperatures of the surrounding walls, glazing, and floor influence the plants, even though they have limited or no contact with these surfaces. Plant leaf surface temperature is an important indicator of the amount of incoming and outgoing radiation. Leaf temperature has a significant impact on the rate of photosynthesis. Therefore, leaf temperature measurements reveal important information about plant status.
An infrared thermometer (fig 20.2.2) measures surface temperature. This is a line-of-sight instrument and detects the radiant temperature of object(s) it can “see”. Infrared thermometers look like hand-held hair dryers with a small, circular sensing element that is aimed at a surface. It does not touch the surface, but it detects the wavelength of thermal energy emitted from that surface, which is displayed as a radiant temperature. The instrument’s field of view widens with increasing distance between the object of interest and the instrument. Therefore, be sure that it is not also detecting adjacent surfaces. Measuring the surface temperature of small objects will require having the instrument close up. A large object, such as a ceiling, can be evaluated while standing several feet away. Be sure to evaluate all surfaces the plants can “see” from their vantage point.
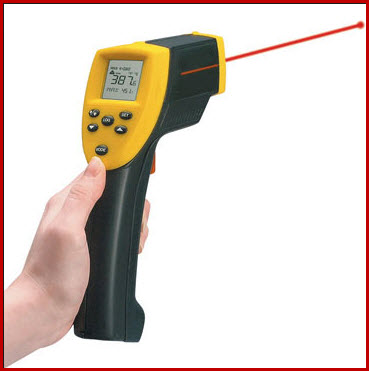
Fig 20.2.2 Infrared thermometer
(Source: www.whisperparanormal.info )
20.3 HUMIDITY
The traditional way to measure relative humidity is a two-step process: First obtain wet bulb and dry bulb temperatures, and then convert it to relative humidity using a psychrometric chart. The dry bulb temperature is commonly measured with a standard thermometer. The wet bulb temperature is determined from a standard thermometer modified with a wetted fabric wick covering the sensor bulb. Sufficient airflow is provided over the wick material so that as water evaporates from the wet wick, the temperature falls and the thermometer reading reflects the wet bulb temperature. A clean bulb wick soaked with distilled water (to prevent salt build up on the wick) provides the best accuracy. The wick will have to be wet continuously if continuous measurements are required. With a wet wick, measured temperatures must be above freezing. Air movement can be provided through an aspirated box (with a fan) or by whirling the dry bulb/wet bulb thermometer through the air.
The traditional relative humidity instrument, called a sling psychrometer(fig 20.3.1), contains both dry bulb and wet bulb thermometers. The sling around swiftly (creating an air speed of approximately 900 feet per minute [fpm] around the thermometer bulbs) on a jointed handle for about three minutes to obtain sufficient air movement needed to extract an accurate wet bulb temperature. A mechanically aspirated psychrometer operates on the same principles as the sling psychrometer, except that a battery powered fan moves air over the wet wick. Air speed over the wet wick is better controlled by an aspirated psychrometer than it is by whirling a sling psychrometer. In order to take a reading with a sling psychrometer, the psychrometer must be stopped, which immediately begins to change the properties of the wet wick. Hence, the mechanically aspirated readings are usually more reliable. Accuracy of the thermometers, careful reading of temperatures, and psychrometric chart interpretation are important.
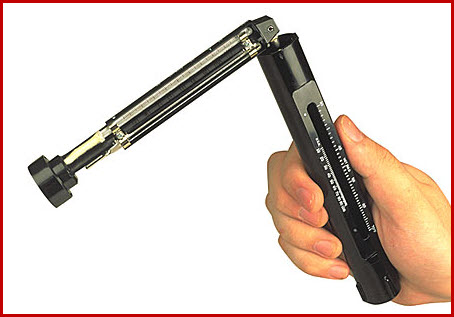
Fig 20.3.1 Compact sling psychrometer
(Source: www.education.nachi.org )
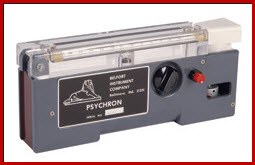
Fig 20.3.2 Aspirated psychrometer
(Source: www.belfortinstruments.com )
Relative humidity can be measured directly by using hygrometer (fig. 20.3.3). Newer hygrometers determine relative humidity with solid-state devices and electronics. The sensor is a matrix material in which electrical properties change as water molecules diffuse into or out of the matrix material in response to air moisture content. The sensor materials may not tolerate conditions near saturation. So reliability of many relative humidity sensors is questionable when the relative humidity rises above 95%. Condensation on the hygrometer surface coats the matrix material so that water molecules no longer diffuse in or out. Until the condensation is evaporated, the hygrometer will often display inaccurate humidity readings or there may be a permanent change in electrical properties.
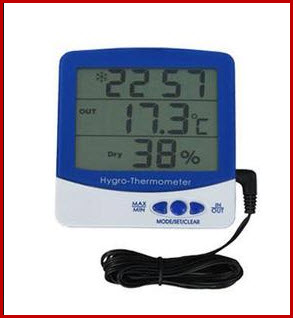
Fig 20.3.3 Digital Thermo Hygrometer
(Source: R-Tech Instruments, New Delhi)
For greenhouse use, look for sensors that can withstand condensing conditions. Most hygrometers also provide a measure of dry bulb temperature. Hygrometers offer the advantage of direct relative humidity measurements and are available in several categories based on price and accuracy. More accurate hygrometers (with an accuracy of ±1 percent) are preferred but are more expensive. Generally, hygrometer prices have gone down and reliability has improved over the past several years. On some models, maximum and minimum temperature and relative humidity can be captured over a pre-determined time period.
20.4 AIR SPEED
Air speed is measured with an anemometer. Two types of anemometers are common, depending on the type of airflow being measured: vane anemometers and hot-wire anemometers. Both instruments are composed of two connected parts: one is the sensing probe and the second displays air speed. One key concern in using an anemometer is to take measurements while air speed and direction are minimally altered by the instrument’s placement. In addition, the operator should stand away (as much as possible) from the airflow being measured. For reference, air moving less than 50 fpm is considered still air.
A hot-wire anemometer (fig 20.4.1) has a very fine, short wire, often the thickness of a human hair, positioned between two supports. A more rugged design uses a thicker wire, which incorporates a temperature-sensing thermistor. The wire is heated by electronic circuitry and air flowing over the wire causes its temperature to decrease. By detecting this temperature decrease, or by evaluating the amount of current supplied to keep the temperature of the wire from decreasing, the anemometer determines the speed of the passing air. The hotwire portion of the instrument is fragile and care must be taken to protect it from physical damage, which can be caused, for example, by large airborne dirt particles. A hotwire anemometer is the instrument of choice for low air speed measurements. Air that is virtually still (<50 fpm) exists in many greenhouses, especially away from ventilation inlets and outlets. Due to their small size, hot wire anemometers can be used in small places, such as the inlet opening of a ventilation system, or in hard to reach spaces, such as ducts.
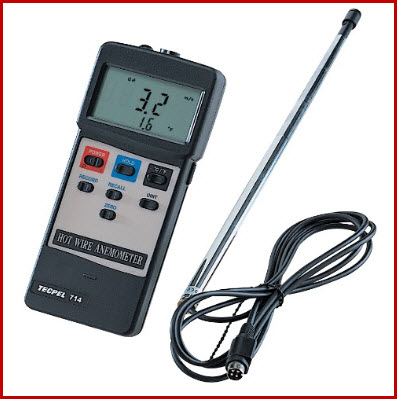
Fig 20.4.1 Hot wire anemometer
(Source: www.tecpel.com.tw )
A vane type anemometer (fig 20.4.2) is more rugged and usually less expensive than a hotwire anemometer. It is well suited to evaluate several agricultural applications. Designs vary, but most have a three inch-diameter vane propeller, which starts turning when the propeller is held in an air stream. Since it takes air speed measurements based on a larger area than the hot-wire anemometer, it is better for determining airflow over the face of a fan, in a large duct, or across a large ventilation inlet opening. Vane anemometers do not measure low air speeds because the mass of the vane requires a fair amount of air movement to induce rotation. Vane anemometers are not considered accurate below 50 to 70 fpm, even though the meter displays a velocity at these low air speeds. Vane anemometers must be used in air streams that are at least as wide as the vane diameter. They will not accurately measure narrow inlet air jets that are smaller than the diameter of the vane anemometer propeller. Vane anemometers with small, one-inch diameter vane heads are available for small air stream measurements, yet they still cannot detect low air speeds. For low speed (< 50 fpm) air measurements, a hotwire anemometer is required. One of the available options on a vane anemometer is an averaging mode where velocity is displayed as a running average value over time. This is a helpful feature when scanning a fluctuating air stream.
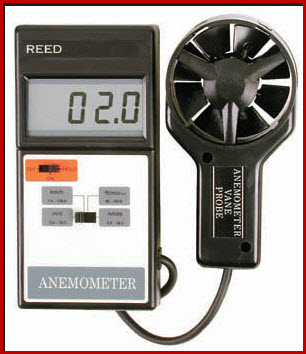
Fig 20.4.2 Vane type anemometer
(Source: www.vitcolab.com )
Velocity manometers may be used in well-defined air streams of relatively high velocity air (> 400 fpm). A Pitot tube is positioned so airflow directly affects the sensing tip, and therefore streamlined air is more desirable than turbulent flow. A velocity pressure is detected, from which air speed is determined. A floating ball in the instrument’s air tube indicates the velocity reading.
20.5 AIRFLOW VISUALIZATION
It is sometimes helpful to visualize airflow to determine how air is mixing or where it forms dead zones. Unusual air leaks (open doors and windows, or cracks in the structure) affect the operation of a ventilation system. Visualizing streamline patterns in greenhouses has some limitations, but nevertheless several methods can be used. Devices that generate smoke are the most common and come in gun, stick, candle, and bomb formats, with an increasing amount of smoke, respectively.
Smoke candles (Fig 20.5.1) are rated according to their duration and volume of smoke they produce. Smoke bombs have been used, but the abundant smoke quickly obscures visualization of the airflow patterns and is frequently an irritant to humans. Smoke bombs are sometimes used to release fumigants in plant production facilities to control various pests. Plants should not be present if harmful techniques are used, but since their presence usually affects how airflow patterns develop under normal conditions, their removal may provide unrealistic airflow patterns. It is best to keep the plants in place and use compatible airflow visualization methods. The above mentioned smoke devices use combustion to produce smoke, so they also generate heat. This thermal effect tends to produce rising smoke.
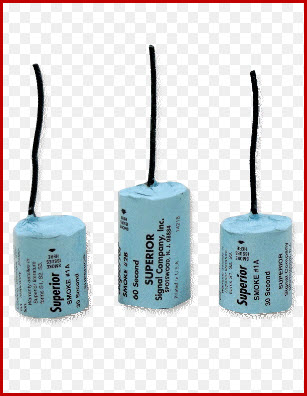
Fig 20.5.1 Smoke candles
(Source: www.clenair.com )
Smoke sticks (Fig 20.5.2) and guns use chemical reactions to produce smoke, so they exhibit few thermal effects. Smoke sticks produce the equivalent of several cigarette’s smoke and look like glass tubes filled with cotton. They produce smoke for several minutes once the end is broken off with a cap on the tip) provides small smoke puffs. This allows smoke to be produced intermittently, rather than the unstoppable stream provided by the combustion devices. A rubber bulb on the handle of a smoke gun provides smoke in puffs or in a continuous stream. The disadvantage is that the small amount of smoke dissipates quickly and may not visualize well, especially in bright light. In addition, the smoke is irritating and the stored sticks can be corrosive once broken. Even rubber parts of the smoke gun may deteriorate from chemical corrosion.
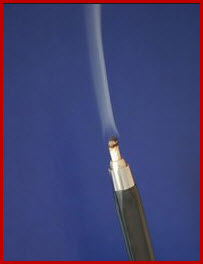
Fig 20.5.2 Smoke stick
(Source: www.hayes-uk.com)
Very small, neutrally-buoyant soap bubbles, filled with helium and released with compressed air, can last long enough to show airstreams within an enclosure. The soap bubbles are surprisingly durable in a free air stream but will not tolerate many impacts with obstructions. The apparatus used to generate bubbles is cumbersome and expensive compared to other airflow visualization devices. Children’s soap bubble toys are the least expensive option and can be useful in faster-flowing airstreams but they are not neutrally buoyant. These bubbles exhibit downward gravitational effects (due to the weight of the soap film), which obscures accurate visualization of the true airflow. Theatrical smoke units produce large quantities of a non-irritating fog through the heating of glycol fluid. This is the atmosphere enhancing fog used For special effects in a theatre (dry ice may also be used). Since the theatrical smoke is warmer than ambient air it will exhibit upward convection. The unit is rather large, being similar in size to a breadbox, relatively expensive, and heavy at about 30-pounds.
A set of air speed streamers (Fig 20.5.3) may be used to detect air speed at various greenhouse locations. Threads of string or ribbons of plastic tape can be “calibrated” to a specific size so that they blow horizontally at a particular airflow of interest. Attached to small posts, these inexpensive free to-spin streamers can be positioned in many locations as indicators of the local airflow and direction. As conditions are changed in the structure under investigation, a quick survey of the streamers will indicate which areas are receiving the desired airflow. For example, if a mechanical ventilation system inlet air speed of 700 fpm or faster is desirable, streamers which have been “calibrated” to blow horizontally at 700 fpm are positioned at various inlet locations to observe whether inlet air speeds are indeed at least 700 fpm.
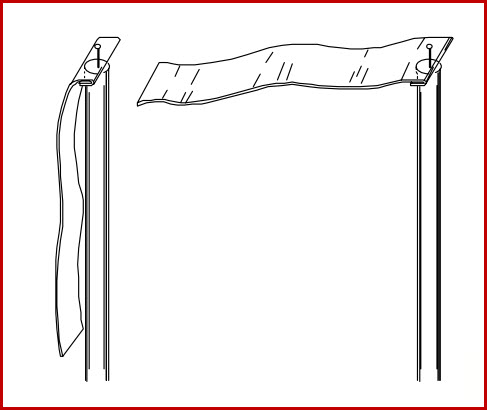
Fig 20.5.3 Air speed streamers
(Source: Both A.J 2002)
20.6 GASES
Carbon Dioxide: Plants use carbon dioxide [CO2] to grow and develop in a process called photosynthesis in which they convert carbon dioxide and water into necessary building blocks. They use (solar) radiation as their energy source and produce oxygen during the conversion process. Greenhouse growers frequently increase plant production through supplementation of carbon dioxide in the greenhouse environment. The carbon dioxide concentration is commonly expressed in units of parts per million (ppm), i.e., the number of molecules of carbon dioxide per one million molecules of air. The so-called ambient carbon dioxide concentration is around 350 to 400 ppm. Growers usually enrich the greenhouse environment to a level of around 1,000 ppm. This moderately elevated carbon dioxide concentration has no ill effects on animals or humans. During the night (without light for photosynthesis) or during periods when ventilation is required to maintain the target indoor temperature, carbon dioxide enrichment is discontinued.
Continuous monitoring of CO2 concentration is done as part of some greenhouse environmental control systems. Most carbon dioxide sensors determine the carbon dioxide concentration by measuring the absorption of infrared light as an air sample passes through a small detection chamber. Portable carbon dioxide monitors (Fig 20.6.1) can be even more expensive than permanently mounted units.
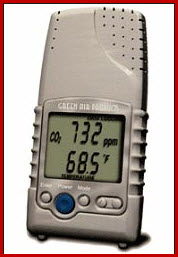
Fig 20.6.1 Portable CO2 monitor
(Source: www.4hydroponics.com )
Contaminant Gases: Carbon monoxide [CO] and NOX (nitric oxide NO, and nitrogen dioxide NO2) gases are common by-products of the incomplete combustion of fossil fuel in heating systems. Proper maintenance and operation of heating systems should prevent the accumulation of these gases in greenhouses. Ethylene [C2 H4 ] gas is a by-product of plant metabolism. It is considered a plant hormone because it can stimulate stem elongation and flowering, and promote ripening of fruits. In properly ventilated plant production facilities, ethylene concentrations rarely cause problems, but in closed germination rooms ethylene accumulation can cause undesirable plant responses (e.g., leaf epinasty and flower abortion).
A portable and relatively inexpensive way to detect gas levels is with a hand-held sampler pump. This manually operated, piston-type pump draws an accurate sample of ambient air through a detector tube. It is very important to hold the pump so the air pulled in through the detector tube comes from the location of interest; this means holding it near the plant during the sampling period for plant-level measurements. Remote sampling is possible for hard-to-reach areas. Dozens of gas and vapor-specific detector tubes are available, including ones for carbon dioxide, carbon monoxide, NOX, and ethylene. Several types of sampling pumps are available, such as a design with rubberized bulb that is squeezed for sampling. The pump and detector tubes must be compatible. As with other instruments, the sampling pump needs to be periodically checked for leakage and calibration.
The thin glass detector tube is specific to the type of gas that is being measured. For example, if the presence of carbon monoxide is a concern in the boiler room, a detector tube filled with a carbon monoxide-sensitive material would be attached to the pump. The contents of the tube react with the air contaminants and change color. The length or shade of the color change in the detector tube indicates the concentration of gas in the sample. Tubes come in a choice of measurable ranges so that accurate analysis is possible. Each tube is used once to obtain a reading and then discarded. Diffusion tubes are an option for monitoring gas levels over a long period of time rather than the spot check provided by the sampler pump and tubes. Diffusion tubes are glass tubes filled with a reactive material specific to the gas of interest. Once both glass end tips are broken off, the tube is placed into the greenhouse environment for a number of hours (tube directions will help determined sampling time by type of tube and anticipated gas level in the environment). The average gas level over the measured time period is easy to calculate based on the distance of color change in the tube. This is a lower cost solution compared to the sampler pump and tube system, is equally reliable, and provides an indication of average gas level over a longer time interval.
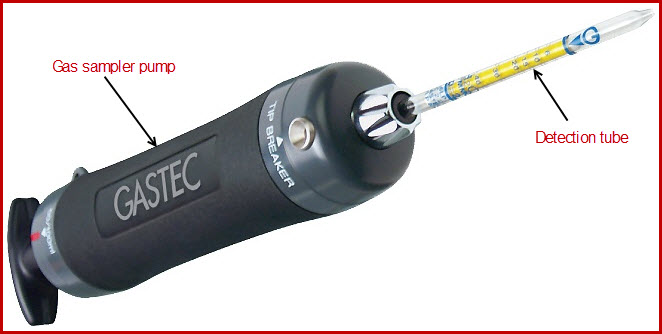
Fig 20.6.2 Gas sampler pump and detection tube
(Source: www.equipcoservices.com )
20.7 LIGHT LEVEL
Although not distinctly a part of the aerial environment, light level has such a major impact on greenhouse aerial environment that it is hard to ignore. Instruments for measuring light are available in a variety of formats which emphasize the wavelengths of light being measured. Various wavelengths of radiation are designated into ranges of interest for specific applications such as visible light, ultraviolet light, photo synthetically active radiation, etc. The units of measurement may appear confusing as different light meters may measure in different units that are not easily convertible to wavelengths of interest for plant growth.
Of most interest for plant growth is a meter that measures photo synthetically active radiation (PAR). These quantum sensors (Fig 20.7.1) measure light wavelengths from 400 to 700 nm, which approximate the photosynthetic response of plants. Units of measure are micromoles per square meter per second (µmol m-2s-1 ). Special- Quantum Sensor sized manufacturers offer quantum sensors.
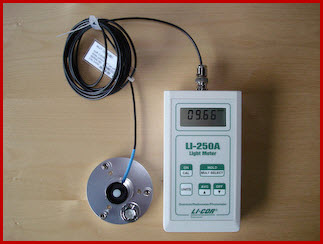
Fig 20.7.1 Quantum sensors
(Source: www.helsinki.fi )
More commonly found light meters measure visible light are known as photometric sensors (approximately 380 to 770 nm). These meters measure light radiation as perceived by the human eye. Units of measure include foot-candle (fc), which is the U.S. system unit of measure, or lux, which is the S.I. measure [1 fc = 10.76 lux]. Many visible light meters offer display of light readings in both fc and lux. Visible light is similar in range of wavelength to PAR with more visible light meters available at less cost than quantum meters. A pyranometer measures solar irradiance that includes ultraviolet, visible, and infrared wavelengths (approximately 280 to 2,800 nm). Units of measure are energy units (Wm-2 )
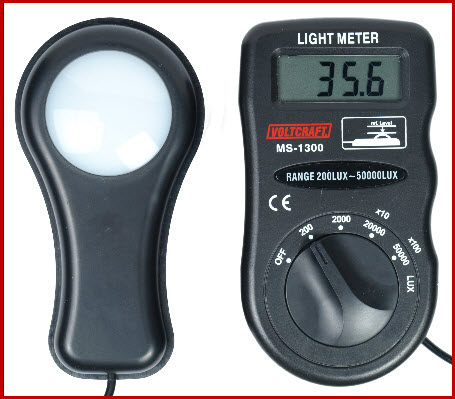
Fig 20.7.2 Photometric meter
(Source: www.en.wikipedia.org )
Expose the sensor to the light level of interest. Avoid shading the sensor and keep it level. It is important to stand away from the sensor as a human body can not only cast shadow on the sensor but provides a dark surface from which little diffuse light reflects. Place the sensor near the top of the plant canopy to determine light level. Obviously, the light level will be brighter near the top of a plant canopy or near the greenhouse glazing. More sophisticated sensors provide a choice to display the light intensity based on the light source (e.g., sunlight, incandescent, fluorescent, or high intensity discharge (HID) such as high pressure sodium and metal halide) Combination Instruments In the past few years, instruments with a modest price tag have been developed which incorporate sensors for several environmental features.
Humidity combined with temperature has been common but more affordable and reliable instruments are now available which monitor relative humidity directly rather than from wet bulb and dry bulb calculations. A small headed vane anemometer has been included in units that sense air speed, temperature, and relative humidity.
20.8 DUST
Dust is a difficult environmental parameter to measure and the appropriate equipment is expensive. Dust particles need to be separated by size to determine the respirable portion. This dust goes directly to the lungs and contributes to health problems. Dust, in general, is detrimental to animals, workers, equipment with moving parts, and, in extreme cases, to plants as well. Air samples may be taken and submitted to a lab where a cascade impactor, or similar device, is used to determine dust levels in a range of sizes.
This ON and OFF type instruments are time consuming, vulnerable to human error and hence, less accurate and unreliable.
Thus greenhouse needs sophisticated set up equipped to react most of the climate changes occurring inside. It works on a feedback system which helps it to respond to the external stimuli efficiently. This set-up overcomes the problems caused due to human errors.
REFERENCES
1. Both A.J. and Eileen fabian wheeler (2001). “Instruments for Monitoring the Greenhouse Aerial Environment”. Part 2 of 3, Rutgers Cooperative extension, New Jersey Agricultural experiment station , Rutger.