Site pages
Current course
Participants
General
Module 1: Introduction and Concepts of Remote Sensing
Module 2: Sensors, Platforms and Tracking System
Module 3: Fundamentals of Aerial Photography
Module 4: Digital Image Processing
Module 5: Microwave and Radar System
Module 6: Geographic Information Systems (GIS)
Module 7: Data Models and Structures
Module 8: Map Projections and Datum
Module 9: Operations on Spatial Data
Module 10: Fundamentals of Global Positioning System
Module 11: Applications of Remote Sensing for Eart...
Lesson 16 Introduction to GIS
16.1 Definition
A geographic information system (GIS) is basically a computerized information system like any other database, but with an important difference: all information in GIS must be linked to a geographic (spatial) reference (latitude/longitude, or other spatial coordinates).

There are many different definitions of GIS, as different users stress different aspects of its use. For example:
(i) ESRI defined GIS as an organized collection of computer hardware, software, geographic data and personnel designed to efficiently capture, store, update, manipulate, analyze and display geographically referenced information.
(ii) ESRI also provided a simpler definition of GIS as a computer system capable of holding and using data describing places on the earth’s surface. (Shown in Fig. 16.1).
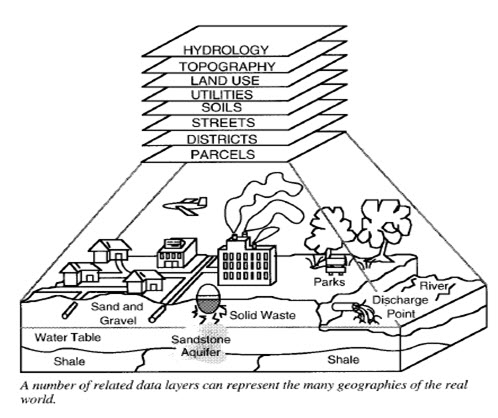
Fig. 16.1. Real world data layers
(Source- IAI Summer Institute 19 July 2000).
(iii) Duecker defined GIS as a special case of information systems where the database consists of observations on spatially distributed features, activities or events, which are definable in space as points, lines or areas. A GIS manipulates data about these points, lines or areas to retrieve data for ad hoc queries and analyses.
(http://www.naarm.ernet.in/virtual/downloads/GIS%20concepts.pdf)
16.1.1Toolbox-based definitions.
A powerful set of tools for collecting, storing, retrieving at will, transforming and displaying spatial data from the real world. (Burrough, 1986)
A system used for capturing, storing, checking, manipulating, analysing and displaying data which are spatially reference to the Earth. (Department of Environment, 1987)
An information technology stores, analyses, and displays both spatial and non-spatial data. (Parker, 1988)
16.1.2 Database definitions.
A database system in which most of the data spatially indexed, and upon which a set of procedures operated in order to answer queries about spatial entities in the database. (Smith, 1987)
Any manual or computer based set of procedures used to store and manipulate geographically referenced data. (Aronoff, 1989)
16.1.3 Organization-based definitions
An automated set of functions that provides professionals with advanced capabilities for the storage, retrieval, manipulation and display of geographically locate data. (Ozemoy, Smith, and Sicherman, 1981)
An institutional entity, reflecting an organizational structure that integrates technology with a database, expertise and continuing financial support over time. (Crater, 1989)
A decision support system involving the integration of spatially referenced data in a problem solving environment. (Cowen, 1988)
(http://www.tiger.esa.int/TrainingCds/cd_01/content_2/sez_2_3/Unit-III-GIS.pdf)
16.1.4 System flow approach
From the very start, GIS practice emphasized the S word: systems perhaps the most pervasive metaphor for the twentieth century (Harvey, 1997b). Operations research, developed as a distinct practice during World War II, provided a technique of `systems analysis' that helped bring the computer into nearly every part of modern life. GIS was not alone in being conceived as a series of procedures that lead from input to output; from data sources through processing to displays.
Marble (1990) elaborated the definition in more expansive form by detailing four `subsystems':
A data input subsystem which collects and/or processes spatial data derived from existing maps, remote sensors, etc.
A data storage and retrieval subsystem which organizes the spatial data in a form which permits it to be quickly retrieved by the user for subsequent analysis, as well as permitting rapid and accurate updates and corrections to be made to the spatial database.
A data manipulation and analysis subsystem which performs a variety of tasks such as changing the form of the data through user-defined aggregation rules or producing estimates of parameters and constraints for various space-time optimization or simulation models.
A data reporting subsystem which is capable of displaying all or part of the original database as well as manipulated data and the output from spatial models in tabular or map form. The creation of these map displays involves what is called digital or computer cartography. This is an area which represents a considerable conceptual expansion of traditional cartographic approaches as well as a substantial change in the tools utilized in creating the cartographic displays.
This definition offers a sense of the stages of operation, but little about the internals. The adjectives `quickly', `rapid' and `accurate' tell us little about the means of organization. The definition of one system as a set of four `subsystems', arranged in linear sequence, adopts a recursive strategy in which systems are explained by more systems.
While the basic system flow definition continues to be used, as the widespread adoption of GIS began in the 1980s, there was a sense that the definition was overly technical (Rhind 1996). One of the most commonly cited alternatives was developed by a Delphi panel of thirty specialists, Nicholas R Chrisman that Geographic Information System is a system of hardware, software, data, people, organizations and institutional arrangements for collecting, storing, analyzing and disseminating information about areas of the earth (Dueker and Kjerne, 1989).
While definitions pop up everywhere, there is remarkably little attention given to comparing definitions and to evaluating them. Cowen (1988) provided four approaches to a definition: process-oriented, application, toolbox, and database. Maguire (1991) described the approach to GIS from three viewpoints: the map view, the database view, and the spatial analysis view.
DeMers (1997) told that tools that allow for the processing of spatial data into information, generally information tied explicitly to, and used to make decisions about, some portion of the Earth.
Star and Estes (1990) described that an information system that is designed to work with data referenced by spatial or geographic coordinates; both a database system with specific capabilities for spatially-referenced data, as well as a set of operations for working with the data.
Clarke (1997), referring to Burroughs (1986): A powerful set of tools for storing and retrieving at will, transforming and displaying spatial data from the real world for a particular set of purposes. He also told that it is an automated system for the capture, storage, retrieval, analysis and display of spatial data.
Ron Abler (1988): GIS are simultaneously the telescope, the microscope, the computer, and the Xerox machine of regional analysis and synthesis of spatial data.
Although divisions of definitions occur in the literature, in practice it is rather arbitrary to assign a particular definition to just one approach. Some of the definitions reported come from the traditional literature sources, but some are drawn from the World-Wide Web, a forum of increasing importance for the description of the field and its promotion to newcomers.
(http://www.naarm.ernet.in/virtual/downloads/GIS%20concepts.pdf)
16.1.5 Changing the subject
There has been a substantial effort to shift the emphasis by declaring that GIS should stand for `Geographic Information Science' (Goodchild 1992).
Goodchild's original intent was neatly summarized in his unapologetic chapter in
Ground Truth:
GIS . . . has done much to remove the traditional isolation between photo- grammetry, remote sensing, geodesy, cartography, surveying, and geography (one could add to this list computer science, operations research, spatial statistics, cognitive science, behavioral psychology, and any other discipline with interests in the generic issues of spatial data). In an earlier paper, I argued that these were the disciplines of geographic information science, and that it made more sense for the research community to decode the GIS acronym in this way, focusing on the generic issues of spatial data, rather than on the limited solutions offered by today geographic information system products (Goodchild 1995, p 42 emphasis in original). (Nicholas, 1999)
A geographic information system (GIS), in a narrow definition, is a computer system for the input, manipulation, storage and output of digital spatial data. In a more broad definition it is a digital system for the acquisition, management, analysis and visualization of spatial data for the purposes of planning, administering and monitoring the natural and socioeconomic environment. It represents a digital model of geography in its widest sense (shown in Fig. 16.2). (Gottfried Konecny. Geoinformation-Remote Sensing Photogrammetry & Geographical Information Systems).
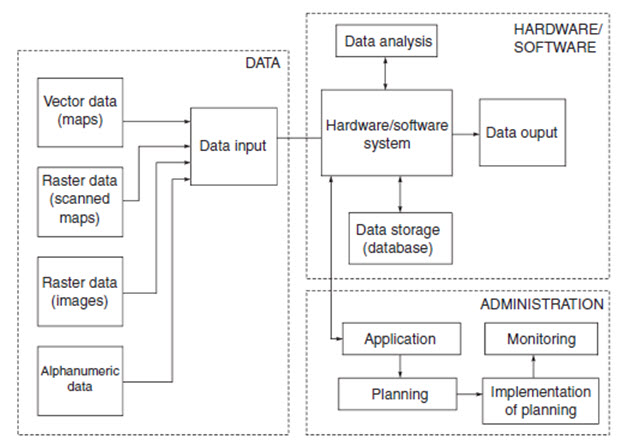
Fig. 16.2. Concept of a geographic information system
(Source-Geo-information, by Gotfried Conecny)
16.2. Component
There are four main components of a true GIS system (Marble 1990). These are:
Data input system: collects and/or processes spatial data from existing sources such as maps, remote sensing data, images, etc. Data can be "collected" through digitizing, scanning, interactive entry, etc.
Data storage and retrieval: organizes spatial data and allows for quick retrieval and updates (i.e., editing).
Data analysis and manipulation: allows for changing form of data, simulation modeling, spatial-temporal comparison, etc.
Output: displays spatial database and analysis in graphic (i.e., map) or tabular form.
(Biology 483: Application of GIS (2002). Applications of geographic Information
Systems (GIS): Introductory Lecture)
GIS component can also be divided by in this manner:
Computer hardware.
Sets of application software modules.
Skilled people to manage it.
1. Computer hardware
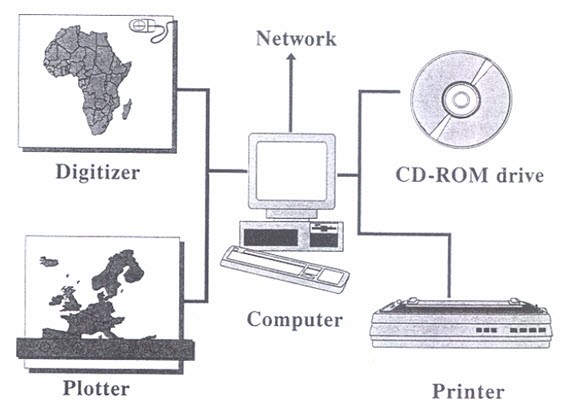
Fig. 16.3. Major hardware components of a geographical information system.
(Source- http://www.tiger.esa.int/TrainingCds/cd_01/content_2/sez_2_3/Unit-III-GIS.pdf)
Table: 16.1.The basic computer hardware components.
|
Item |
Usage |
|
Hard disk drive |
Storing data and programs |
|
Digital tape cassettes, optical CD-ROM’s etc. |
Storage of data |
|
Digitizer or Scanner |
Converts maps and documents into digital form |
|
Plotter, Printer or any other display device |
Gives the output of data processing |
|
Local & Global electronic network with either of the following:
|
Provides Inter-Computer communication
|
|
Computer screen, Keyboard & mouse or other pointing device |
To control the computer and the peripherals such as the digitizer, plotter, printer etc. which are linked to the computer |
(Source: http://www.tiger.esa.int/TrainingCds/cd_01/content_2/sez_2_3/Unit-III-GIS.pdf)
2. GIS Software
The software modules can be grouped as follow-
Data input and verification
Data storage and database management
Data output and presentation
Data transformation
interaction with the user
(http://www.tiger.esa.int/TrainingCds/cd_01/content_2/sez_2_3/Unit-III-GIS.pdf)

Fig. 16.4. The main software components of a geographical information system.
(Source-(http://www.tiger.esa.int/TrainingCds/cd_01/content_2/sez_2_3/Unit-III-GIS.pdf)
16.2.1 GIS Functional Components
Because of the different origins these systems have, it's important to understand each of the functional components of a GIS. Each of the various GIS software packages emphasizes certain aspects of spatial data handling and deemphasizes or omits others. The degree of emphasis placed on development of certain features depends on the marketplace a vendor is targeting. None of the current GIS software packages place their emphasis on the defense community; therefore, an understanding of the basic components of a GIS is needed. Understanding these underlying concepts will help users in their research of the technology and also in the development of applications for the defense community (NSA, 2008).
Data capture and input processing
The first GIS component is Data Capture and Input Processing. In order to successfully implement a GIS, one must have data available for the study area. This includes the acquisition of the data, its digitization, and the appropriate tagging of attributes. Sources may include hard copy maps, existing digital data, imaginary and tabular data. The format, coordinate system, and geographic projection of the data must be known before input into a GIS. One must also be able to generalize the data and select only the amount of data are necessary for a particular project. Digital data take up a huge amount of storage space on computer systems; therefore the thinning and proper selection of this data is important. Most of the GIS software packages have algorithms and methods to aid in. this process. One must also be aware of the amount of error that exists in the data being used and fully understand its limits and implications in project accuracy. Inherent data errors have been a traditional bottleneck in the development of GIS technology. Research is currently being done to help quantify this error (NSA, 2008).
Digital data formats
"All data that can be mapped have both a locationl (x,y) and nonlocational (i.e., attribute) characteristics.. These attributes can be both qualitative (e.g., the land use at a location) and quantitative (e.g. the elevation at the same location). In addition the attributes data location can be monitored through time. These three components location, attribute and time - represent the content of most GIS. This information has to be somehow represented inside the GIS. Map data in this particular format are called digital data, and the process of getting the data into this format is called digitization. Digital data are represented in the computer as large sets of numbers, not as analog images. Two different data structures are commonly used to represent map data inside the GIS: raster and vector representations. Four fundamental types of geographic data have to be stored within a GIS: point lines, polygons, and surfaces. T Raster and vector data representations use different techniques to store points, lines, polygons, and surfaces. These techniques will be discussed because they provide a basis for comparison of the two different types of digital data representations (NSA, 2008).
Data storage and data management
The second functional component of a GIS is the role of data storage and the management of these data. Once the data encoded in their proper digital format, they must be stored in the GIS. Most of the GISs use a database mode to store these data. Today's Geographic Information Systems can use either a hierarchical network or a relational database model to achieve this component. The geographic information is arranged in files of related information, each file being called a layer. Each of these layers can be combined or overlaid upon each other to form new layers. These newly created layers form the basis for geographical analysis and can be queried to answer questions of interest to the user. Each of the attributes associated with this geographic data is stored in the database alongside its data structure and is queriable.
Since the amount of data needed is usually large, it's recommended that someone interested in setting up a GIS obtain the proper amount of disk storage. With the price of disk space decreasing and the storage capability on each hard disk drive increasing, the space requirements needed for these databases are becoming obtainable. One must always pay attention to the storage capacity demands of both the GIS package itself and the digital data being used for the project (NSA, 2008).
Data manipulation
The third functional component of a GIS is the role of data manipulation. To extract meaningful information from a GIS .database, one must be able to query it and ask logical questions. The leading database model used in GIS technology is the relational database. Relational databases have the ability to join different attribute tables to create new relationships among the data. This concept is important to the GIS in that the geographic data are stored in the database along with its attribute tables, which enhance the geographic data. This relationship helps make all features within a GIS queriable. When layers of data are combined, the attribute information for this material is carried along and also becomes queriable. As new information is added to the database and geographic layers are combined among themselves, the newly created geographic and spatial queries aid in performing actual analysis on the data. For example, a typical query could be to find all features of a defined type within a certain area. Another is to find all features that are adjacent to a specified feature. A third is to find all features that are a certain distance from another defined feature. A point and click type query could also be implemented (e.g., point to a road and tell me the attributes that are associated with that road) (NSA, 2008).
Data display and output
The fourth and final functional component of a GIS is the role of data display and output. All GIBs should include software for this capability and they should provide means for both soft- and hardcopy output. The ability to interface with output peripherals such as wax thermal printers and plotters to be able to produce a map depicting the results of analysis is important to say the least. Report generation and business graphic generation are necessary for some applications. Geographic Information Systems have been found to be lacking in this arena. Tabular data could be imported into desktop publishing packages or spreadsheet packages with little trouble to compensate for this deficiency. Spreadsheet packages could be used to produce graphical output displays such as histograms and time/frequency plots. One should also understand the types of maps he wants to produce when evaluating GIS software packages. Consider this list of maps when deciding what type of output capability a package has: polygon/cloropleth maps, contour/isarithm maps, three-dimension/perspective map and grid-cell maps (NSA, 2008).
16.3 Architecture
Geographic information systems (GIS) are becoming more usual due to the improved performance of computer systems. GIS applications are being developed using the three-tier software architecture traditionally used for general purpose information systems. Even though this architecture is suitable for GIS applications, the special nature and exclusive characteristics of geographic information pose special functional requirements on the architecture in terms of conceptual and logical models, data structures, access methods, analysis techniques, or visualization procedures. The architecture of general-purpose information systems must consist of three separate tiers, namely: the presentation tier, the application logic tier (or business logic tier), and the data tier. The main advantage of this architecture is that it enforces a strict separation of the functionality of the system into three different independent modules that interact only at well-defined interfaces. This enables a developer to modify each one of these modules of the application with little impact on the others. Therefore, this architecture provides increased performance, flexibility, maintainability, reusability and scalability. Even though the three-tier architecture for general-purpose information systems is suitable for GIS, the special nature and exclusive characteristics of geographic information pose special functional requirements on the architecture in terms of conceptual and logical models, data structures, access methods, analysis techniques, or visualization procedures. For instance:
Special data types and operations are needed to represent and manipulate geographic information.
Geographic information requires many different analysis and visualization procedures.
Geographic information is typically voluminous with a naturally imposed hierarchical structure.
Geographic information processing is characterized by transactions that are much longer than a typical standard relational database transaction.
There are two different conceptual views of geographic space: an object-based view and a field-based view.
These and other features impact the overall architecture of a GIS. (Miguel et al., 2005)
16.3.1 System Architecture
The special nature of geographic information makes more important the fulfillment of some requirements of general-purpose information systems, such as flexibility, extensibility, reusability, scalability, reliability, and security. In order to provide these features, the architecture of the GIS must be based on an extensible DBMS providing geographic information management services, and a collection of modular, highly-distributed, geographic information processing and visualization services (Miguel et al., 2005)
16.3.2 A Generic Architecture
This architecture is heavily influenced by the proposals of the ISO/TC 211 and OGC, and reuses the work of these organizations where their specifications are mature. Fig. 16.5 shows the proposal of a generic architecture for geographic information systems. The architecture separates the functionality of the system in three independent tiers, namely the Data Tier, the Application Logic Tier and the Presentation Tier. The Presentation Tier is responsible for implementing the user interface of the system, displaying the maps and providing some basic functionality over them. Finally, the Application Logic Tier implements the problem-solving functionality of the system. (Miguel et al., 2005)

Fig. 16.5. A Generic System Architecture for GIS.
(Source: Miguel et al., 2005)
16.3.3 Web GIS Architecture:
In performing the GIS analysis tasks, WEB GIS is similar to the client/server typical three-tier architecture. The geo-processing is breaking down into server-side and client-side tasks. A client typically is a Web browser. The server-side consists of a Web server, Web GIS software and Database (Fig. 16.6) (Helali, 2001)

Fig. 16.6. How a typical WEB GIS model works.
(Source: Alesheikh et al, 2001)
This model of network widely exists within enterprises, in which some computers act as servers and others act as clients. Servers simply have the proprietary GIS running, and add a client interface at the client side and a middleware at the server side to communicate between the client and the proprietary GIS software. Recent development in object oriented programming make it possible to produce software components, and send them to the client before running it in the client machine, such as Java classes, ActiveX components and plug-ins. This comes out to the thick client GIS. The thick-client architecture let the client machine do the most processing works locally. Both thin and thick-client systems have some advantages and drawbacks, but they are not the best solution in terms of taking advantage of network resources. (Alesheikh et al, 2001)
16.3.3.1 Thin Client Architecture (Server Side Applications)
The thin client architecture is used in typical architecture. In a thin-client system, the clients only have user interfaces to communicate with the server and display the results. All the processing is done on the server actually as shown in Fig. 16.7. The server computers usually have more power than the client, and manage the centralized resources. Besides, the main functionality is on the Server side in thin architecture there is also the possibility for utility programs at the server side to be linked to the server software. Fig. 16.3 shows schematic communication between Web browser, Web Server and GIS server. On the Web Server side, there are some possibilities to realize the GIS connection to the World Wide Web; CGI, Web Server Application Programming Interface (API), Active Server Pages (ASP), Java Server Pages (JSP) and Java- Servlet. The descriptions of the five possibilities mentioned above are in Helali, (2001).
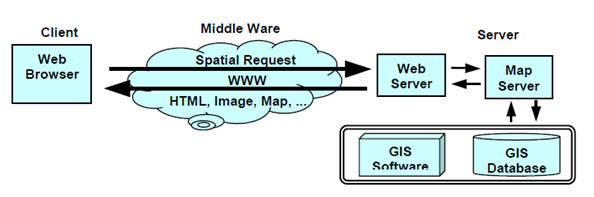
Fig. 16.7. Server Side Application.
(Source: Alesheikh et al, 2001)
The user on the client side does not need any knowledge about the linkage of the IMS at the server side, but the system administrator or application developers should be familiar with these techniques. This Architecture used in ESRI ArcView IMS, Map Objects IMS and MapInfo Map Xtreme systems.
Major advantages of this model driven form Data Base centralization and are:
Central control
Easy for data eminence/updating
Keep the latest version
Generally cheaper
Integration possibilities
Regarding some cartographic aspects such as font
And disadvantages are:
Not responsive to local needs: users have different invokes
No local accountability: accountability need application in client side
Large data volume (size of the database)
Response time slow: users use a browser and it take long time to download new HTML frame
Less interactive: in client side there is limited application and browsers abilities
Vector data does not appear in client side: browsers without additional plug-in cannot read vector files.
(Alesheikh et al, 2001)
16.3.3.2 Thick Client Architecture (Client Side Applications)
In general, a Web browser can handle HTML documents, and embedded raster images in the standard formats. To deal with other data formats like vector data, video clips or music files, the browser's functionality has to be extended. Using exactly the same client sever communication in Thin Client architecture, vector files format could not be used. To overcome this problem most browser applications offer a mechanism that allows third tier programs to work together with the browser as a Plug-in. The user interface functionality has progressed from simple document fetching to more interactive applications. This progress is as follows: HTML, CGI, using HTML forms and CGI, Java script to increase user interface capabilities, Java applets to provide client-side functionality. Currently user interface capabilities combined with remote invocations (Fig.16.8) (Byong-Lyol, 1998).
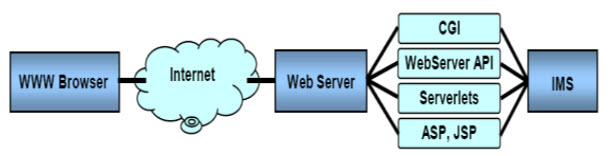
Fig. 16.8. Client Side Applications.
(Source: Alesheikh et al, 2001)
Major advantages of this model are:
Document/graphics standards are not required
Vector data can be used
Image quality not restricted to GIF and JPEG
Modern interface is possible; it is not restricted to single-click Operations
And disadvantages to Client Side GIS
Nonconformance cans limits
User base
Users require to obtain additional software
Platform/browser are incompatible
(Alesheikh et al, 2001)
16.3.3.3 Medium Client Architecture
For avoiding vector data in client side and reducing problems of previous architectures, Medium Client is suggested. With using extensions in both client and server side, clients may have more functionally than Thin client architecture. In Fig. 16.9 these four components in interactive map are pictured as services, each with interfaces, which can be invoked by clients of that service. (Alesheikh et al, 2001)

Fig. 16.9. Medium Client position in Open GIS point of view.
(Source: Alesheikh et al, 2001)
In other words, if a user's computer contains just the display service, then that user would be said to be using a thin client. If the user's computer additionally contained a render service, then that user would be said to be using a medium client. And finally, if the user's computer also contained the display element generator service that would indicate the user is using a thick client. After some consideration, it was decided that while this distinction may be somewhat helpful in describing web mapping, the terms "thick client" and "thin client" were already encumbered by very imprecise definitions used in marketing literature and were therefore not suitable for continued use in some cases (Doyle, 1999). (Alesheikh et al, 2001)
16.3.3.4 Distributed Architecture
Recent developments in information technology have resulted in a number of distributed object architectures that provide the framework required for building distributed applications. The framework also supports a large number of servers and applications running concurrently. Many of such frameworks provide natural mechanism for interoperability (Kafatos, 1999). For example, Distributed Component Object Model architecture in windows platform and Java Remote Method Invocation (RMI) in Java Virtual Machine (JVM) are the most popular protocols that are used in different cases. These architectures may be applied to GIS to improve the traditional client/server GIS model and develop scalable distributed GIS model. Some attempts have been made in the academic area (Zhang, 1998).
The general idea of the distributed GIS service model is that a client program, in either an Internet browser or an independent application, should be able to access the resources distributed in the entire network. The resources here refer to both geo-data and geo-processing components available in the network. The client and the server in this context do not refer to a specific machine. Any machine, when it requests the remote resources during the processing, is a client, and any machine that provides such resources is a server. In a specific program, a client may connect to several servers if needed and a specific machine may be the client at one time and the server at another time. An ideal distributed GIS service model should be a "geo-data anywhere, geo-processing anywhere" model, which means the geo-data and geo-processing tool, could be distributed with the largest flexibility virtually anywhere in the network. The geo-data and geo-processing components do not have to be in the same site, but they should be able to cooperate or integrate whenever they are needed to finish a specific task (Yuan, 2000). (Alesheikh et al, 2001).
Keywords: GIS, GIS Functional Components, GIS Software, System Architecture, Web GIS.
References
Alesheikh AA., Helali H., Behroz HA. K.N. 2001, Toosi University of Technology. Web
Biology 483: Application of GIS (2002). Applications of geographic Information
Generic Framework for GIS Applications. Spain.
Geographical Information Systems.
GIS: Technologies and Its Application.
Gottfried Konecny. Geoinformation-Remote Sensing Photogrammetry &
http://www.naarm.ernet.in/virtual/downloads/GIS%20concepts.pdf
http://www.tiger.esa.int/TrainingCds/cd_01/content_2/sez_2_3/Unit-III-GIS.pdf
IAI Summer Institute (2000). GIS: Definitions, Software.
Miguel Luaces R., Nieves Brisaboa R., José Paramá R., and Jose R. Viqueira. A
Nicholas Chrisman R (1999), What Does ‘GIS’ Mean? Washington.
NSA (2008). Geographic Information Systems.
Systems (GIS): Introductory Lecture.
Last modified: Monday, 27 January 2014, 10:04 AM