Site pages
Current course
Participants
General
Module 1. IMPORTANCE OF SAFE WATER SUPPLY SYSTEM
Module 2. DOMESTIC WATER REQUIREMENTS FOR URBAN AN...
Module 3. DRINKING WATER QUALITY AND INDIAN STANDA...
Module 4. INTRODUCTION TO WATER TREATMENT, DOMESTI...
Module 5. SEWER: TYPES, DESIGN DISCHARGE AND HYDRA...
Module 6. INTRODUCTION TO DOMESTIC WASTEWATER TREA...
Module 7. SOLID WASTE: QUANTITY, CHARACTERISTICS A...
Module 8. INTRODUCTION TO AIR POLLUTION. TYPES OF ...
Module 9. ISI STANDARDS FOR POLLUTANTS IN AIR AND ...
Lesson-24 Quantity of solid waste estimation
Information on waste quantity and composition is important in evaluating alternatives in terms of equipment, systems, plans and management programmes. Based on the quantity of wastes generated, one can plan appropriate means for separation, collection and recycling programmes. That is to say, the success of solid waste management depends on the appropriate assessment of quantity of wastes generated. This lesson deals with the estimation of quantity of solid waste
The quantity of solid waste generated depends on a number of factors such as
-
food habits,
-
standard of living
-
degree of commercial activities
-
seasons
The quantity of solid waste can be expressed in units of volume or in units of weight. The advantage of measuring quantity in terms of weight rather than weight is that weight is fairly constant for a given set of discarded objects, whereas volume is highly variable. Waste generated on a given day in a given location occupies different volumes in the collection truck, on the transfer station, in the storage pit or in a landfill. In addition, the same waste can occupy different volumes in different trucks or landfills. Hence, its always preferable to express the quantity of solid waste on weight basis.
The best method for estimating waste quantity is to install permanent scales at disposal facilities and weigh every truck on the way in and again in the way out. At disposal facilities without permanent scales, portable scales can be used to develop a better estimate of the weight of waste being deliverd. Selected trucks are weighed and environmental engineers use the results to estimate the overall weight of the waste stream. Weighing all trucks entering the disposal facility is a tedious job and hence a method of truck selection must be done. A simple approach will be to weigh every nth truck (for instance, every 4th truck) that delivers waste to the facility. This approach assume that the trucks weighed represent all trucks arriving at the facility. The total waste taonnage can be estimate can be estimated with the following equation
W = T (w/t)
Where,
W is the total weight of the waste delivered to the facility
T is the total number of trucks that delivered waste in the facility
w is the total weight of the truck that were weighed
t is the number of trucks that were weighed
Similarly the total weight of waste delivered for the whole year is summed up and total tones of waste generated in a year can be calculated.
The quantity of solid waste is often expressed in kg per capita per day so that the waste streams in different areas can be compared. The quantity is typically calculated with the following equation
Q = 1000 T / 365 * P
Where, Q – Quantity of waste in kg per capita per day
T – Tonnes of waste generated in a year
P – Population of the area in which the waste is being generated
Data on quantity variation and generation are useful in planning for collection and disposal systems. Indian cities now generate eight times more municipal solid wastes than they did in 1947 because of increasing urbanization and changing life styles. Municipal solid wastes generation rates in small towns are lower than those of metro cities, and the per capita generation rate of municipal solid wastes in India varies in towns and cities. It was also estimated that the total municipal solid wastes generated by 217 million people living in urban areas was 23.86 million t/yr in 1991, and more than 39 million ton in 2001. Waste generation rate in Indian cities ranges between 200 - 500 grams/day, depending upon the region’s lifestyle and the size of the city. The per capita waste generation is increasing by about 1.3% per year in India.
Waste generation and GDP
The per capita waste generation rate is strongly correlated to the gross domestic product (GDP) of a country (Table 2). Per capita waste generation is the amount of waste generated by one person in one day in a country or region. The waste generation rate generally increases with increase in GDP. High income countries generate more waste per person compared to low income countries due to reasons discussed in further sections. The average per capita waste generation in India is 370 grams/day as compared to 2,200 grams in Denmark, 2,000 grams in US and 700 grams in China.
| Country | Per Capita Urban MSW Generation (kg/day) | |
| 1999 | 2025 | |
| Low Income Countries | 0.45 - 0.9 | 0.6 - 1.0 |
| Middle Income Countries | 0.52 - 1.1 | 0.8 - 1.5 |
| High Income Countries | 1.1 - 5.07 | 1.1 - 4.5 |

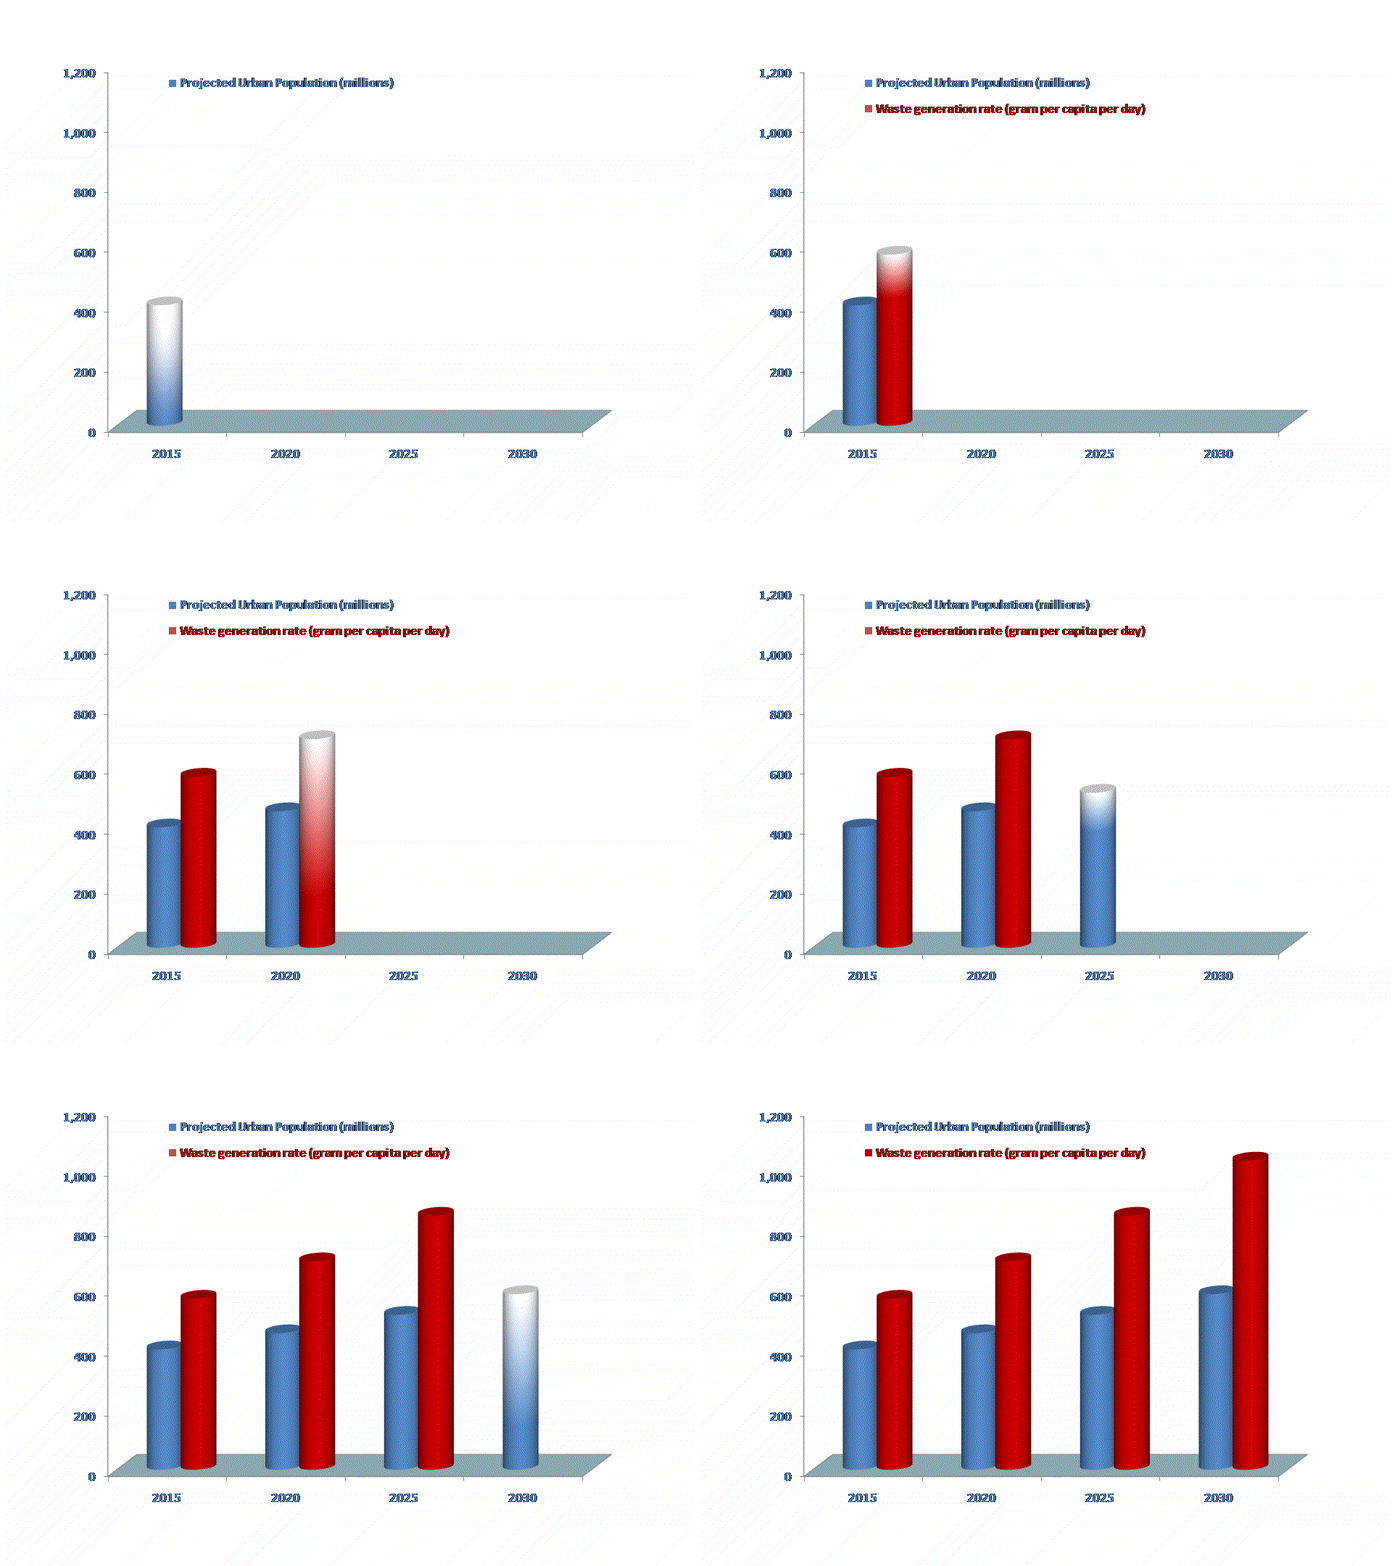
The urban population of India is approx. 341 million in 2010. Figure 1 suggest the projected MSW quantities are expected to increase from 2015 to 2030 and that per capita per day production will increase to 1.032 kg, and urban population as 586 million in 2030.