Site pages
Current course
Participants
General
Module 1 - Water availability and demand and Natio...
Module 2 - Irrigation projects and schemes of India
Module 3 - Concepts and definitions
Module 4 - Command Area Development and Water Mana...
Module 5 - On-Farm-Development works
Module 6 - Water Productivity
Module 7 - Tank & Tube well irrigation
Module 8 - Remote Sensing and GIS in Water Management
Module 9 - Participatory Irrigation Management
Module 10 - Water Pricing & Auditing
LESSON 28. Basics of Remote Sensing and Geographic Information System
Remote Sensing (RS) is the science and art of acquiring information (spectral, spatial, temporal) about material objects, area, or phenomenon, without coming into physical contact with the objects, or area, or phenomenon under investigation. Without direct contact, some means of transferring information through space must be utilised. In remote sensing, information transfer is accomplished by use of electromagnetic radiation (EMR).
Geographic Information System (GIS) that has wide applications in planning any spatially distributed projects. Fundamentally, a GIS is a map in an electronic form, representing any type of spatial features. Additionally, properties or attributes may be attached to the spatial features. Apart from its spatial data analysis capabilities, it provides an interface to remotely sensed images and field surveyed data. In short RS is the process of data capturing and GIS is the tool for analysing the captured data.
28.1 Types of Remote Sensing
28.1.1 In respect to the type of Energy Resources
Passive Remote Sensing: Makes use of sensors that detect the reflected or emitted electro-magnetic radiation from natural sources.
Active Remote Sensing: Makes use of sensors that detect reflected responses from objects that are irradiated from artificially-generated energy sources, such as radar.
28.1.2 In respect to Wavelength Regions
Remote Sensing is classified into three types in respect to the wavelength regions
Visible and Reflective Infrared Remote Sensing
Thermal Infrared Remote Sensing
Microwave Remote Sensing
28.2 Bands Used in Remote Sensing
In satellite remote sensing, cameras are fitted to the orbiting satellite and are focused towards the earth. However, the cameras are special in the sense that they are sensitive to other wavelengths of the electromagnetic spectrum as well. As may be observed from Figure1, the electromagnetic spectrum identifies the wavelength of the electromagnetic energy, of which the visible portion (or light) occupies only a small portion.
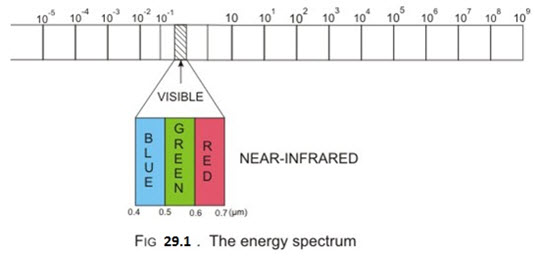
Actually, electromagnetic energy refers to light, heat and radio waves. Ordinary camera or the human eyes are sensitive only to the visible light. But the satellites are equipped with Electromagnetic Sensors that can sense other forms of electromagnetic radiations as well. This includes not only the Blue (0.4-0.5μm), Green (0.5-0.6μm) and Red (0.6-0.7μm) of the spectrum but also longer wavelength regions termed as the Infrared (IR) spectrum (0.7-1000μm), which can again be further subdivided into the following:
a) Photographic IR : 0.7-0.9μm
b) Very near IR : 0.7-1.0μm
c) Reflected/Near IR : 0.7-3.0μm
d) Thermal IR : 3.0-1000μm
Still longer wavelength is the microwave portion of the spectrum, which extends from 3000μm to 3m. The common remote sensing systems operate in one or more of the visible, reflected-infrared, thermal-infrared and microwave portions of the spectrum.
Remote Sensing Technology makes use of the wide range Electro-Magnetic Spectrum (EMS) from a very short wave "Gamma Ray" to a very long 'Radio Wave'. Wavelength regions of electro-magnetic radiation have different names ranging from Gamma ray, X-ray, Ultraviolet (UV), Visible light, Infrared (IR) to Radio Wave, in order from the shorter wavelengths.
28.3 Interaction of electromagnetic radiation and earth
Electromagnetic energy of the sun incident on the earth’s surface reaches fully upto the top of the atmosphere and not all of this energy reaches the surface of the earth, since part of the energy gets either scattered, absorbed or reflected by the atmosphere or cloud cover, if any. Only a part is transmitted upto the earth’s surface. Specifically, it may be said that although the electromagnetic radiation reaching the top of the atmosphere contains all wavelengths emitted by the sun, only specific wave bands of energy can pass through the atmosphere. This is because the gaseous components of the atmosphere act as selective absorbers. Molecules of different gases present in the atmosphere absorb different wavelengths due to the specific arrangement of atoms within the molecule and their energy levels. The main gaseous component of the atmosphere is nitrogen, but it has no prominent absorption features. Oxygen, Ozone, Carbon Dioxide and Water Vapour, the other major components absorb electromagnetic wavelengths at certain specific wavelengths. The wavelengths at which electromagnetic radiation are partially or wholly transmitted through the atmosphere to reach the surface of the earth are known as atmospheric windows, as shown in Fig 29.2.
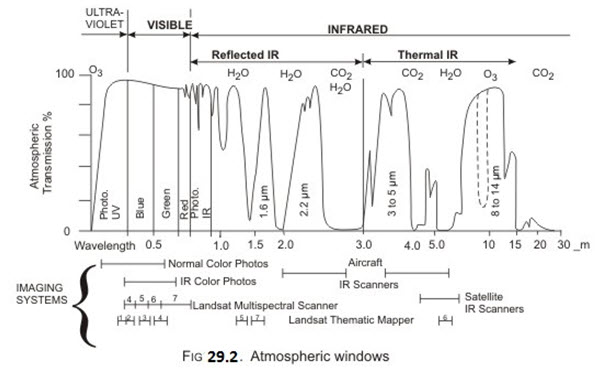
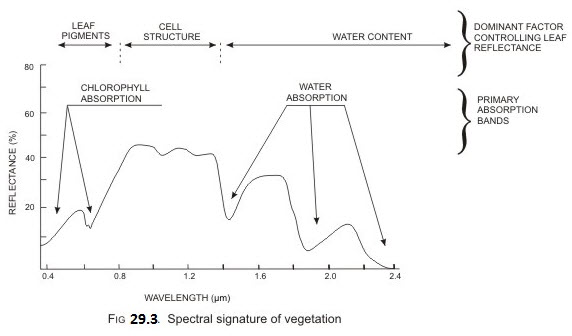
Since these radiations reach the surface of the earth, they are useful for remote sensing as they would be reflected or absorbed by the features of the earth giving the typical signatures for the sensors in the satellite (or any other space borne device) to record. This is shown graphically in Fig 29.3. The remote sensing system sensors are designed in such a way that can capture information for those wavelengths of electromagnetic radiation that occur within the atmospheric windows.
28.4 Energy Interactions, Spectral Reflectance and Colour Readability in Satellite Imagery
All matter is composed of atoms and molecules with particular compositions. Therefore, matter will emit or absorb electro-magnetic radiation on a particular wavelength with respect to the inner state. All matter reflects, absorbs, penetrates and emits Electro-magnetic radiation in a unique way. Electro-magnetic radiation through the atmosphere to and from matters on the earth's surface are reflected, scattered, diffracted, refracted, absorbed, transmitted and dispersed. For example, the reason why a leaf looks green is that the chlorophyll absorbs blue and red spectra and reflects the green. The unique characteristics of matter are called spectral characteristics. Two points about the above given relationship (expressed in the form of equation) should be noted.
The proportions of energy reflected, absorbed, and transmitted will vary for different earth features, depending upon their material type and conditions. These differences permit us to distinguish different features on an image.
The wavelength dependency means that, even within a given feature type, the proportion of reflected, absorbed, and transmitted energy will vary at different wavelengths.
Thus, two features may be distinguishable in one spectral range and be very different on another wavelength brand. Within the visible portion of the spectrum, these spectral variations result in the visual effect called COLOUR. For example we call blue objects 'blue' when they reflect highly in the 'green' spectral region, and so on. Thus the eye uses spectral variations in the magnitude of reflected energy to discriminate between various objects.
A graph of the spectral reflectance of an object as a function of wavelength is called a spectral reflectance curve.
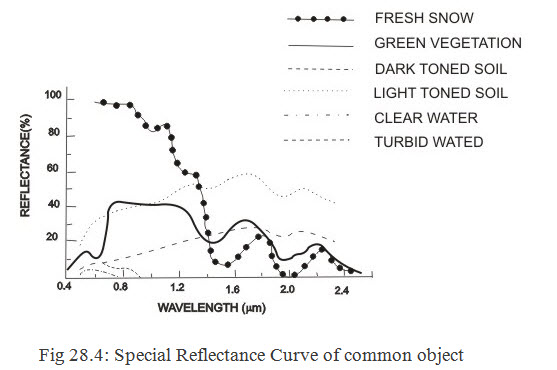
The lines in this figure represent average reflectance curves compiled by measuring large sample features. It should be noted how distinctive the curves are for each feature. In general, the configuration of these curves is an indicator of the type and condition of the features to which they apply. Although the reflectance of individual features will vary considerably above and below the average, these curves demonstrate some fundamental points concerning spectral reflectance.
|
Band |
Wavelength (µm) |
Principal applications |
|
1 |
0.45-0.52 |
Sensitive to sedimentation, deciduous/ coniferous forest cover discrimination, soil vegetation differentiation |
|
2 |
0.52-0.59 |
Green reflectance by healthy vegetation, vegetation vigour, rock-soil discrimination, turbidity and bathymetry in shallow waters |
|
3 |
0.62-0.68 |
Sensitive to chlorophyll absorption: plant species discrimination, differentiation of soil and geological boundary |
|
4 |
0.77-0.86 |
Sensitive to green biomass and moisture in vegetation, land and water contrast, landform/ geomorphic studies. |
28.5 Colour Discrimination based on Wavelengths of Spectral Reflectance
28.5.1 Platforms
The vehicles or carriers for remote sensors are called the platforms. Typical platforms are satellites and aircraft, but they can also include radio-controlled aeroplanes, balloons kits for low altitude remote sensing, as well as ladder trucks or 'cherry pickers' for ground investigations. The key factor for the selection of a platform is the altitude that determines the ground resolution and which is also dependent on the instantaneous field of view (IFOV) of the sensor on board the platform.
28.5.2 Sensors
Active Sensors: Detect the reflected or emitted electromagnetic radiation from natural sources.
Passive Sensors: Detect reflected responses from objects that are irradiated from artificially-generated energy sources such as radar.
The Indian Remote Sensing (IRS) satellites are, till now, equipped with active sensors that record images in four wave bands and others that record in a single wave band. The latest group of satellites available for earth imaging are the IRS-IC/ID. There are three sensors in these satellites, and each has its own characteristics, as given below.
LISS (Linear Imaging Self-Scanning Sensor)-III. This medium resolution sensor that records data in four spectral bands: Two in visible range (0.52-0.59μm and 0.62-0.68μm), one in near infrared range (0.77-0.86μm), and one in short wave infrared (1.55-1.70μm) region. The spatial resolution, that is, the pixel size of the images are 23m for the first three bands and 69m in the last band.
PAN (Panchromatic, or single wave band). This is a high resolution (5.8m pixel size) sensor operating in the 0.50-0.75μm range.
WFS (Wide Field Sensor). This is a coarse resolution (188m) sensor operating in two bands: visible (0.62-0.68μm) and near infrared (0.77-0.86μm).
28.5.3 Resolution
In general resolution is defined as the ability of an entire remote-sensing system to render a sharply defined image.
Spectral Resolution: Spectral Resolution of a remote sensing instrument (sensor) is determined by the band-widths of the Electro-magnetic radiation.
Radiometric Resolution: It is determined by the number of discrete levels into which signals may be divided.
Spatial Resolution: It is determined in terms of the geometric properties of the imaging system.
Temporal Resolution: Is related to the repetitive coverage of the ground by the remote-sensing system.
28.6 Indian Remote Sensing Satellite (IRS)
A satellite with remote sensors to observe the earth is called a remote-sensing satellite, or earth observation satellite. Remote-Sensing Satellites are characterised by their altitude, orbit and sensor. India has launched several satellite includes IRS 1A, IRS 1B, IRS 1C, IRS 1D, IRS P 2,IRS P 3, IRS P 4 for different applications.
28.6.1 Landsat
It is established at an altitude of 700 km is a polar orbit and is used mainly for land area observation. Other remote sensing satellite series in operations are: SPOT, MOS, JERS, ESR, RADARSAT, IKONOS etc.
28.6.2 Basic Concept of LiDAR Mapping
The accuracy and functionality of many GIS projects rely to a large extent on the accuracy of topographic data and the speed with which it can be collected. The recently emerged technique of airborne altimetric LiDAR has gained considerable acceptance in both scientific and commercial communities as a tool for topographic measurement.
The LiDAR instrument transmits the laser pulses while scanning a part of terrain, usually centred on and co-linear with, the flight path of the aircraft in which the instrument is mounted. The round trip travel times of the laser pulses from the aircraft to the ground are measured with a precise interval timer. The time intervals are converted into range measurements, i.e. the distance of LiDAR instrument from the ground point struck by the laser pulse, employing the velocity of light. The position of aircraft at the instance of firing the pulse is determined by Differential Global Positioning System (DGPS). During the movement of aircraft experience lot of distortions in altitude, lateral movements so on but these warps are taken care by the instrument to yield accurate coordinates of points on the surface of the terrain. Laser mappers acquire digital elevation data with accuracies equivalent to those of GPS, but thousands times faster.
28.7 Basics of Digital Image Processing
Remote sensing images are recorded in digital form and then processed by the computers to produce images for interpretation purposes. Images are available in two forms - photographic film form and digital form. Variations in the scene characteristics are represented as variations in brightness on photographic films. A particular part of scene reflecting more energy will appear bright while a different part of the same scene that reflecting less energy will appear black.
Digital image consists of discrete picture elements called pixels. Associated with each pixel is a number represented as DN (Digital Number), that depicts the average radiance of relatively small area within a scene. The size of this area effects the reproduction of details within the scene. As the pixel size is reduced more scene detail is preserved in digital representation. The images recorded by a remote sensing sensor is a digital map of the scene that comprises of a regular grid array of squares, called pixels, with an unique value attached to each. The value of each pixel is proportional to some property, like average reflectance, recorded by the sensor for the equivalent area on the ground. The pixel values normally range from 0 to 255. For example, images recorded in the visible spectrum are usually a combination of three values for each pixel, one each for blue, green and red colours. For each colour, the pixel has a value ranging from 0 to 255. A pixel that records the image of a pure white area, will have the pixel values of all the three bands as 255. For a pure black region, the three individual bands would have values of 0. A blue looking area shall have the value 255 for the image that records the blue colour, and 0 for green and red.
Digital image processing is a collection of techniques for the manipulation of digital images by computers. Digital image processing encompasses the operations such as noise removal, geometric and radiometric corrections, enhancement of images, information extraction and image data manipulation and management.
28.8 Spectral signatures
By deducing earth features from Multi Spectral Scanned (MSS) images the Water Resources Engineer may derive various important information of a wide region of the earth that may be useful for analysis. Hence, primarily, the earth features have to be identified from MSS images based on the Spectral Reflectance characteristics or signatures of various objects. An MSS data of a region comprises of two or more images of the same area that has been scanned by the remote sensing sensor. For example, the LISS-III sensor shall give four images of the area corresponding to the four spectral bands in which the data is collected. Each of these images comprise of data stored for each pixel, which is in the form of a Digital Number (DN) corresponding to the pixel’s average reflectance property in the particular waveband. The DN varies from 0 to 255, and hence, each image may be printed or discussed in a gray-scale. However, all the four images for a region printed or displayed in gray-tone may not be useful individually. Hence, a combined image is produced, called the False Colour Composite (FCC) image, which combines the characteristics of the images of all the four bands.
An FCC image which simulates a colour infrared image, the visual interpretability of features is better than that from image of each band taken separately. The typical colour signatures of some of the features on the surface of the earth in standard FCC is given in the following table:
|
Features on the earth surface |
Colour signature |
|
Healthy reflection Broad leaf type Needle leaf type |
Red to magenta Reddish brown to purple |
|
Stressed vegetation Pre-visual stage Visual stage |
Pink to blue Cyan |
|
Water Clear Turbid due to sediments |
Dark blue/black Light blue |
|
Soil Red soil/red bed outcrop Moist soil Sand-dunes |
Yellow Distinct dark tong Yellow/white |
|
Land-use Uncultivated land City/town |
Blue/white Blue |
|
Others Cloud/snow Shadow* |
White Black with a few visible details |
∗Shadow is not very significant in MSS satellite images with the present day spatial resolution as the scales of features are too small to aid in recognition.
28.9 Image Processing Methods
Image processing methods may be grouped into three functional categories:
28.9.1 Geometric and Radiometric Corrections
The correction of errors, noise and geometric distortions introduced during scanning, recording and playback operations. However, the data supplied by NRSA-Hydrabad is corrected for these errors. Hence, we are restricted to the enhancement techniques and information extraction.
28.9.2 Image Enhancement
Linear Contrast Enhancement: Very few scenes have a brightness range that utilises the full sensitivity range of the detectors. To produce an image with the optimum contrast ratio, the entire brightness range of the display medium, should be utilised. In linear contrast we have to assign the low end as 0 (zero) and the high end as 1(One) and the other values in between are linearly stretched. The linear stretch improves the contrast for most of the original brightness values.
Spatial Filtering: Spatial Filtering is a pixel by pixel transformation of an image, which depends on the grey-level of the pixels concerned as well as the grey level of the neighbourhood pixels. It is a procedure in which grey level of a pixel is altered according to its relationship with respect to the grey level of the neighbouring pixels.
28.9.3 Information Extraction
In the case of information extraction processes the computer makes decisions to identify and extract specific pieces of information.
Computer algorithms are available in Image Processing Software Packages that make use of these numbers to identify the feature of land corresponding to each pixel. The numerical operations carried out on these digital images are grouped as follows:
1. Pre-processing: Removal of flawed data, correction of image.
2. Image registration: Translation, solution or stretching of the image to match earth’s true geometry.
3. Image enhancement: Improving images or image patches that suffer from low contrast between pixel DN values.
4. Image filtering: Methods to identify clearly the boundary between two district regions of separate reflectance characteristics.
5. Image transforms: Combination of one or more images of different spectral bands of the same area.
6. Image classification: Automatic categorization of pixels into various land-cover classes.
Though digital image interpretation has the capability to classify earth surface features with the help of a computer, it must be supplemented with ground truthing, that is, verification of the interpreted regions with actual information gathered from the ground by field survey.
28.10 Geographic Information System (GIS)
A GIS is a computer application program that stores Spatial and Non-Spatial information in a digital form. Spatial information for an area is what is traditionally represented in maps which for a region, may broadly be classified as given in the following table. The corresponding source of such data for our country is also indicated.
|
Sl. No. |
Spatial features of a region |
May be obtained from |
|
1.
|
• Elevation contours • Drainage • Location of roads, towns, villages |
Survey of India, in the form of Topo-Sheets |
|
2.
|
Soil map |
National Burean of Soil Survey and Land Use Planning |
|
3.
|
Geological map |
Geological Survey of India |
|
4.
|
Latest information on land-use and land-cover, like • Vegetation, forest, crops, etc. • Towns, villages and other human habitation • Roads, Embankments, Canals • Rivers |
Satellite imageries |
|
5.
|
Maps of District, Block, Thana, Mouza, Taluk, etc. |
State Land Record office |
|
6.
|
Location of ground water wells and corresponding water tables as observed over time |
Central or State Ground Water Boards |
Non-Spatial data, also called Attributes, refer to information like demographic distribution of a town or a village, width or identification tag of a road (like NH-6), daily discharge of a river at a particular place, etc. Thus, a GIS conveniently manages all variety of data of a given region in a single electronic file in a computer. This is helpful to any regional planner, including that of a Water Resources Project since all information is conveniently stored and accessed with the computer. Further, though the scales of various printed maps may be different, a GIS stores all of them in the same scale. Normally, different spatial features are stored in sub-files, called layers. Hence, one may use the GIS to open all the layers showing all thematic features. Else, one may display one or a few themes at a time by activating the respective layers. For example, the land-use layer may be displayed along with elevation contours, the other layers being kept off.
Important features of GIS software includes handling of spatial and attribute data, data input and editing, data analysis and output of data, which are discussed briefly in the following sections.
A GIS may be considered to comprise of the following components:
A software package, the components of which include various tools to enter, manipulate, analyse and output data
A computer system, consisting of the hardware and operating systems.
28.11 Handling of spatial and attribute data in GIS
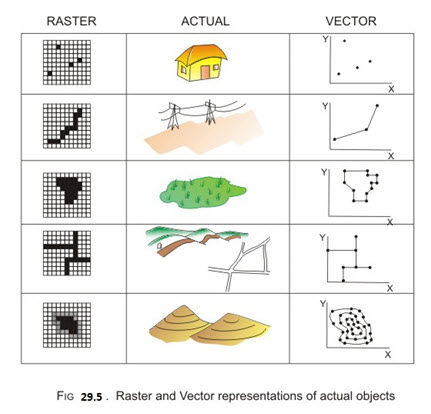
There are two types of data storage structures in a GIS-Raster and vector. According to the Raster system, the space is assumed to be divided into a grid of cells, with a certain value attached to each cell according to the data that is represented by a grid of cells, would be done by marking the corresponding cells black (and assigning a value 1), with all other cells remaining vacant (that is, assigning a value of 0). In the vector system of data storage, the particular point would be stored by the coordinates of the location. This was an example of a point feature. Other types of geographic features include line, area, network of lines and surface, which have been shown in Fig 29.5.
It may be noticed that in the raster grid representation of an area, the size of the grids is a choice of the person using the GIS. For example, in representing the spatial information of a town, a grid size of 10 to 25 m may be sufficient but for a state, 100 to 250 m would be enough. Adopting a finer grid size would, naturally, provide a better representation of data. But that would require a higher computer storage space, which therefore has to be judged optimally.
For vector data representation, too, a better resolution of data may be achieved for line features by selecting more number of points closely. This applies also for representing the lines defining the boundary of an area. For surface representing more number of points defining the elevation contours would result in a more precise definition of the region.
Attribute data is non-spatial, that is, it is not something that varies continuously in space. This is actually the database that defines the spatial data. For example, the location of ground water wells is a spatial data, but the water level record or variation of water level with time is an attribute data of the particular well. Similarly, rivers may be represented as a network of lines, but the width and average depth at different points would be represented as attribute data.
28.12 Input and editing of data in GIS
The user of a GIS has to input data, whether Spatial (in Raster or Vector formats) or Non-Spatial (usually in the form of tables). Spatial data may be obtained from different sources and in different formats, as listed under 29.11. They may be input into a GIS in a variety of methods, depending on the format in which they are being supplied. For example, maps would usually be supplied in printed sheets but the satellite image of an area or the land-use map derived from it would be in electronic, that is digital, form. The latter may be directly transferred to a GIS but the former has to be Scanned and then Digitized. Scanning means producing an electronic file of the image, which would usually be a raster representation of the map. This may be done with the help of scanners that are available from sizes of A4 (the smallest) to A0 (the largest). The scanned images are not of much use to a GIS since it does not differentiate between the different objects indicated in the image. For this, manual help is required in the form of Digitization, where by a person uses a mouse over the scanned image to physically point to the various features and store them in GIS format. In order to do this, the vectorization tools of the GIS software would be used. Tabular attribute data may be directly transferred to a GIS and attached to the corresponding spatial data with certain tools provided by the GIS software. All the various data are stored in a GIS as layers, or themes.
After data input, the uses might have to edit some of the data to remove duplicacy, redundancy, etc. of some of the vector data or to remove specks or ‘noise’ in raster data. The errors in the vector data appears while undergoing the process of digitization and therefore, has to be corrected before an analysis with the data is made. For example, while digitizing the boundary of a reservoir from a map, the starting and ending points may not be located right over one another. The GIS would not recognize the outline as a closed boundary, and the reservoir plan cannot be defined as an area. Hence, an editing has to be done to correct this deficiency. Errors in raster data appear due to a variety of reasons, one being the presence of aberration during data capture. For example, LISS-III MSS imagery of an area used to classify land-use may be misrepresented by the presence over some places, unless these are removed, they may lead to false interpretation of land-use classification.
Once spatial and attribute data have been enclosed and edited, it may be necessary to process the different data obtained through various sources in such a way, that all are geometrically compatible.
Some of the mathematical transformations used in this process are:
1. Translation and scaling
2. Creation of a common origin
3. Rotation
28.13 Analysis of data in GIS
Once the derived data has been input in a GIS, they are analysed to derive meaningful information. Infact, analysis is essential for any decision-making strategy that may be derived from the stored GIS data. For example, imagine a GIS data that provides locations of ground water wells of a region and their corresponding water levels measured every month. This is overlain with the village boundary data of the region. By plotting the ground water table surface for every month, it may be seen which villages consume more water and when. In this simple example, the analysis is between two different data sets but overlain in the same GIS.
More complicated analysis may be done by interacting more themes or data layers. For example, if it is required to obtain the names of the villages that suffer from excess groundwater depletion in summer and also whose population is more than 10,000 then the population attribute data has to be considered in the query. Another example of using three layers for data analysis includes that of finding the names of the villages that are within 1 km distance from a river and also located at an elevation of 50 m or less. In this case, the river feature has to be ‘buffered’ with a 1 km zone on either bank and the surface area below 50 m elevation has to be plotted from the digitized contour map. On top of this, the layer representing digitized boundaries of villages has to be overlain to get the desired output.
Though the above examples are only limited to analysis of recorded data, considerable scope lies in the use of GIS data along with mathematical modeling tools that mimic physical processes. For example, watershed runoff model may be conveniently integrated with GIS to provide answers like:
Which areas of a watershed produce more runoff if a rainfall of a particular intensity is given?
If the land-use map of the area is overlain on the above is it possible to find out the areas that are prone to excessive soil erosion?
Hence, a GIS database may become extremely useful, if coupled with a modelling software. Much work on similar lines has been done by Prof. Maidment of University of Texas by integrating GIS with hydrologic process models. Interested users may visit the following site for more information in the following web-site:
http://www.ce.utexas.edu/prof/maidment/GISHYDRO/home.html
28.14 Data output in a GIS
The most common form of output from a GIS is a map. In many cases, a thematic map would be that illustrate the spatial variation or pattern in a particular variable. Apart from maps, a GIS output may be in the form of table, like that that showing the names of villages whose groundwater drawdown is more understandable may be output for the decision-makers. For example, the ground water table contour may be output as a three dimensional surface, which may provide a visual guide to the trend of the water table’s dip.
Last modified: Tuesday, 18 February 2014, 9:12 AM