Site pages
Current course
Participants
General
Module 1. Design and operational parameters
Module 2. Performance evaluation and maintenance a...
Module 3. Performance evaluation and maintenance a...
Module 4. Performance evaluation and maintenance a...
Module 5. Performance evaluation and maintenance a...
Module 6. Performance evaluation and maintenance a...
Module 7. Biodiesel utilization in CI engines
Lesson 31. Engine testing for biodiesel blends
31.1. Engine testing
The different blend levels adopted for the Engine testing study are Diesel 100% (D100), Biodiesel 20% and diesel 80% (B20), Biodiesel 40% and diesel 60% (B40), Biodiesel 60% and diesel 40% (B60), Biodiesel 80% and diesel 20% (B80) and Biodiesel 100% (B100).
31.2. Performance evaluation of biodiesel blends in Power tiller engine under laboratory condition
An engine test rig was developed specifically for the purpose of testing Power tiller engine. The test rig used an electrical dynamometer consisting of an AC generator and load created by a panel of incandescent bulbs. The torque input into the dynamometer was measured by a transmission torque sensor. The rated speed of the engine is 2200 rpm and that for the dynamometer is 1500 rpm. A ‘V” belt speed reduction device was provided between engine output shaft and the dynamometer input shaft. The engine was modified by mounting three grove V belt pulley of 110 mm pitch circle diameter at the center of the fly wheel in place of the original pulley. The engine, V belt drive, torque transducer and alternator were mounted on a frame structure.
The drive from the engine pulley was transmitted to a speed reduction pulley on the dynamometer shaft. The larger pulley had a pitch circle diameter of 160 mm, so as to provide a speed reduction of 1:1.45. The driven pulley was mounted on a 40 mm diameter shaft which was supported on a two pedestal bearings. The bearings in turn were mounted to support brackets welded on the main frame. The torque transducer used for measuring the line torque was mounted on separate pedestal in line with the dynamometer shaft. The pulley shaft torque transducer and alternator were coupled through suitable flange couplings. The overall view of the experimental setup is shown in Fig. 7.
The Power tiller engine performance was evaluated using IS test code 9935-1981, the test was carried out at two different conditions of the engines.
Torque – Speed test at varying throttle setting
Varying load test
31.2.1 Torque–Speed test at varying throttle setting
During this test, the power, torque and fuel consumption were measured as a function of speed by gradually loading after stabilized working condition of the engine. Stable operation conditions were maintained for a minimum period of 5 minute at each load setting before beginning the test measurement. The no-load engine speed before and after every test was recorded to verify that there is no change in throttle setting.
The Torque - Speed curve of power tiller engine was recorded with three high idle speeds of 2200, 2000 and 1800 rpm under different load levels for all the selected biodiesel blends.
After the test, the following characteristics curves of the engine were drawn
Power as a function of engine speed
Torque as a function of engine speed
SFC as a function of engine speed
Fuel consumption as function of engine speed
(i) Torque Vs Speed
The maximum torque at 2200 rpm is 34.15 for D100 but it gradually reduced with increased proportion of biodiesel in the blend and decreases to around 32 Nm.
The different blend shows the reduction of 2-5 per cent torque as compare to diesel. Similarly reduction in maximum torque values was observed at 2000 and 1800 rpm. The maximum torque at rated Power tiller engine speed of 2200 rpm decreased.
(ii) Power Vs Torque
The maximum power obtained at any throttle setting is gradually reduced as the blend become richer in biodiesel. The power at 2200 rpm is differenced by 8.1 per cent for D100 and B100 while the corresponding changes at 2000 and 1800 rpm where
3.8 and 8.1 per cent respectively.
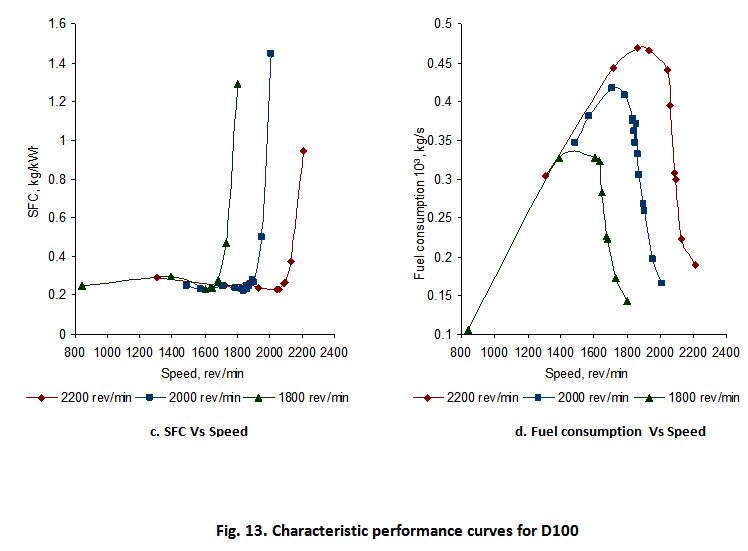
(iii) SFC Vs Speed
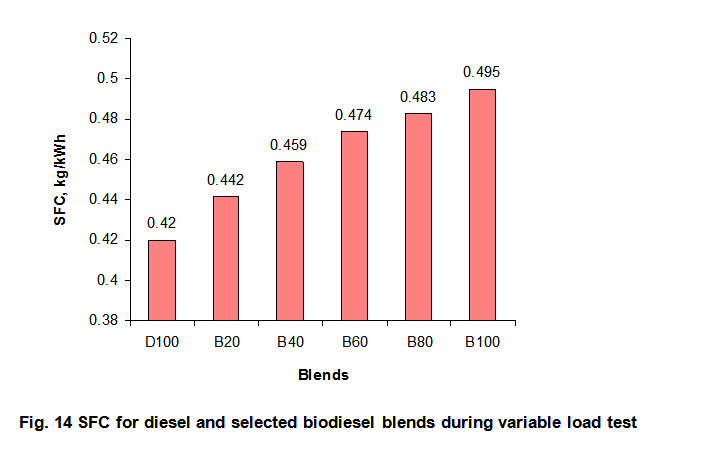
The important observation from the engine testing is the increase in SFC with increase in blend ratio. The minimum SFC for D100 is 0.232 kg/ kWh while it increased to 0.248, 0.25, 0.24, 0.266 and 0.277 as the blend ratio was increased from D100 to B100. The primary reason for the increased in SFC may be the lower calorific value of the fuel as the blend ratio is increased.
The behavior of the engine when operating with different blends was presented in Table 5 and Fig 8 to 13.
Table 5 Torque, Power, SFC and FC Vs Speed of power tiller engine for variable throttle tests
|
Throttle speed, rpm |
Torque Vs Speed |
Power Vs Speed |
SFC Vs Speed |
FC Vs Speed |
|||||
|
Max. T, Nm (1) |
Max |
T/100 rpm (3) |
Max P, kW (4) |
Max |
Min. SFC, kg/kWh (6) |
Min. SFC-S, kg/kWh (7) |
Max. FC, l/h (8) |
Max. FC-S, rpm (9) |
|
|
D100 fuel |
|||||||||
|
2200 |
34.15 |
1933 |
25.60 |
6.91 |
1933 |
0.232 |
2042 |
2.11 |
1864 |
|
2000 |
33.25 |
1735 |
17.71 |
6.04 |
1735 |
0.227 |
1814 |
1.82 |
1753 |
|
1800 |
30.10 |
1604 |
21.05 |
5.06 |
1604 |
0.230 |
1604 |
1.44 |
1604 |
|
B20 blend |
|||||||||
|
2200 |
33.31 |
1853 |
21.44 |
6.65 |
1979 |
0.248 |
2040 |
2.04 |
2041 |
|
2000 |
33.78 |
1667 |
17.12 |
6.1 |
1763 |
0.23 |
1829 |
1.78 |
1667 |
|
1800 |
31.11 |
1533 |
23.11 |
5.24 |
1638 |
0.227 |
1661 |
1.50 |
1638 |
|
B40 blend |
|||||||||
|
2200 |
32.46 |
1764 |
25.77 |
6.39 |
1824 |
0.250 |
1824 |
2.0 |
1978 |
|
2000 |
32.19 |
1621 |
23.13 |
5.89 |
1752 |
0.251 |
1859 |
1.78 |
1752 |
|
1800 |
28.45 |
1558 |
17.62 |
4.76 |
1652 |
0.249 |
1647 |
1.14 |
1532 |
|
B60 blend |
|||||||||
|
2200 |
32.28 |
1758 |
18.15 |
6.79 |
2017 |
0.240 |
1758 |
2.04 |
2017 |
|
2000 |
31.04 |
1742 |
12.52 |
5.66 |
1742 |
0.259 |
1899 |
1.74 |
1742 |
|
1800 |
29.35 |
1608 |
16.89 |
4.95 |
1608 |
0.177 |
1614 |
1.56 |
1608 |
|
B80 blend |
|||||||||
|
2200 |
33.30 |
1835 |
16.30 |
6.51 |
1961 |
0.266 |
1998 |
2.04 |
1961 |
|
2000 |
32.72 |
1728 |
22.23 |
6.01 |
1804 |
0.254 |
1804 |
1.78 |
1805 |
|
1800 |
30.36 |
1519 |
1704 |
4.96 |
1625 |
0.266 |
1550 |
1.48 |
1625 |
|
B100 blend |
|||||||||
|
2200 |
32.48 |
1868 |
23.67 |
6.35 |
1868 |
0.277 |
1789 |
2.04 |
1969 |
|
2000 |
32.19 |
1722 |
17.12 |
5.81 |
1722 |
0.272 |
1815 |
1.83 |
1722 |
|
1800 |
29.21 |
1518 |
18.60 |
4.65 |
1518 |
0.273 |
1630 |
1.59 |
1513 |
1- Maximum Torque, Nm
2- Speed Corresponding value of Maximum Torque, rpm
3- Torque/100 rpm
4- Maximum power, kWh
5- Speed Corresponding value of Maximum Power, rpm
6- Minimum value of Specific fuel consumption, kg/kWh
7- Speed Corresponding value of Minimum Specific fuel consumption, rpm
8- Maximum Fuel consumption, l/h
9- Speed Corresponding value of Maximum Fuel consumption, rpm
31.2.2 Varying load test
The variable load test was conducted as per IS test cod 9935-1981. During this test, speed torque and hourly fuel consumption were measured as a function of power. The test was conducted in following sequence of loading and each load state was maintained for 20 minute duration.
85 per cent of the load corresponding to the load at maximum power
Minimum load
50 per cent of the load defined at (a)
Load corresponding to the load at maximum power
25 per cent of the load at maximum power (a), and
75 per cent of the load defined at (a)
The variable load test was conducted at engine rated speed of 2200 rpm for all blend levels throughout the experiment as per SAE J708c- “Agriculture tractor test code” of Society of Automotive engineers and IS 9935-1981-Test code for Power tiller. The power, torque and fuel consumption were measured as a function of power by gradually loading after stabilized working condition of the engine are reached. The performances of the engine under varying load test with different blends are tabulated from Table 6 to Table 11 and shown in Fig.14.
Table 6 Engine performance during variable load test for D100 at 2200 rpm idle speed

Table 7 Engine performance during variable load test for B20 biodiesel blend at 2200 rpm idle speed
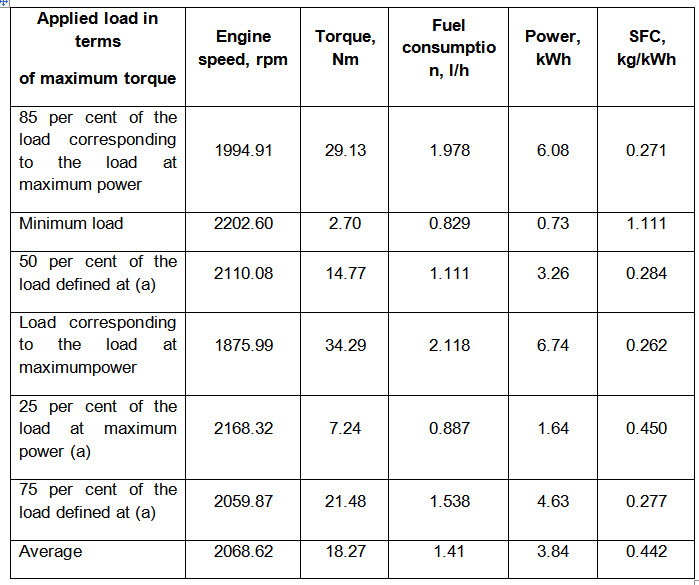
Table 8 Engine performance during variable load test for B40 biodiesel blend at 200 rpm idle speed
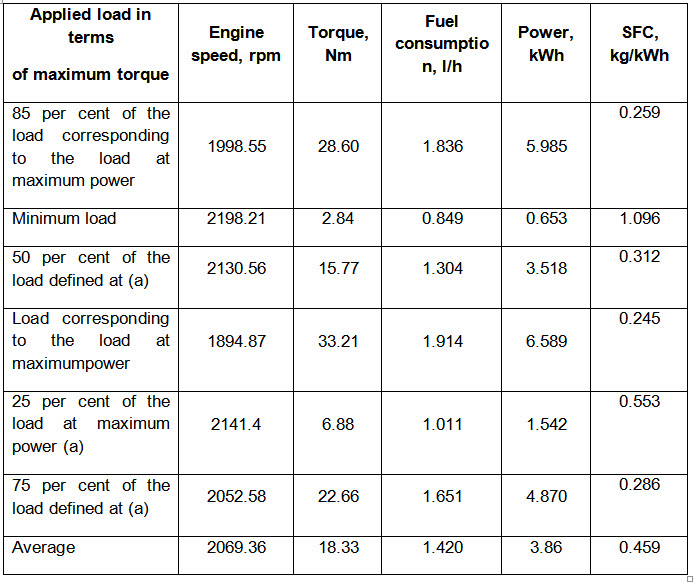
Table 9 Engine performance during variable load test for B60 biodiesel blend at 2200 rpm idle speed
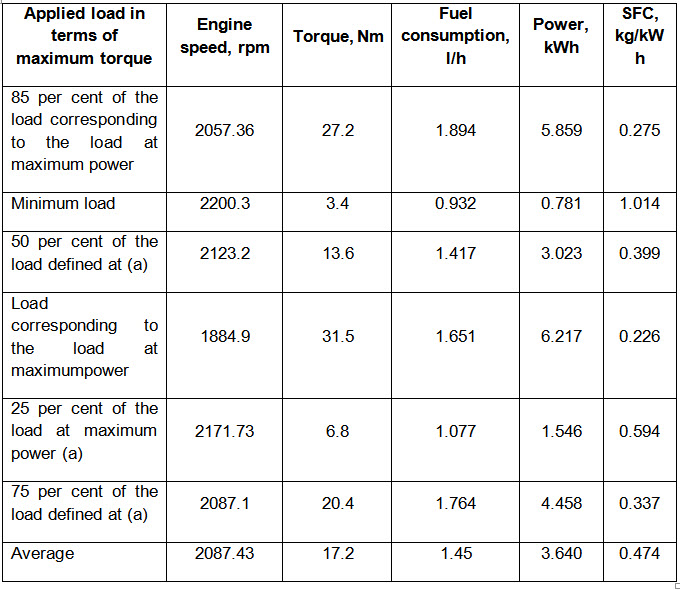
Table 10 Engine performance during variable load test for B80 biodiesel blend at 2200 rpm idle speed
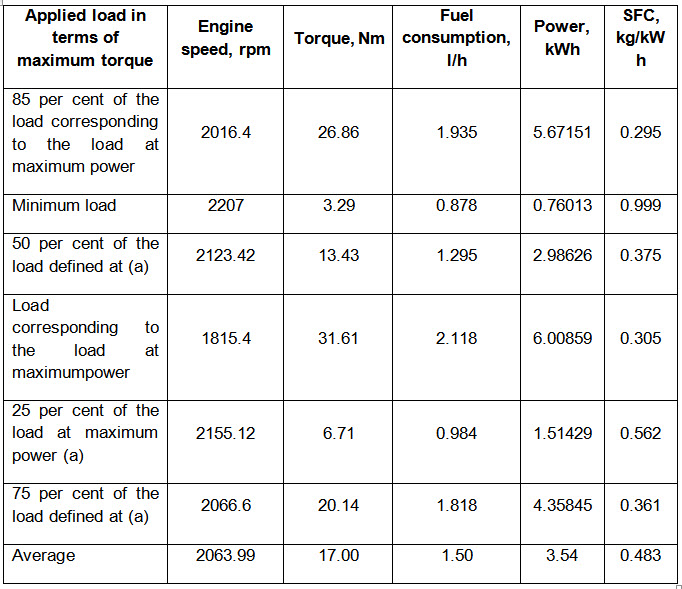
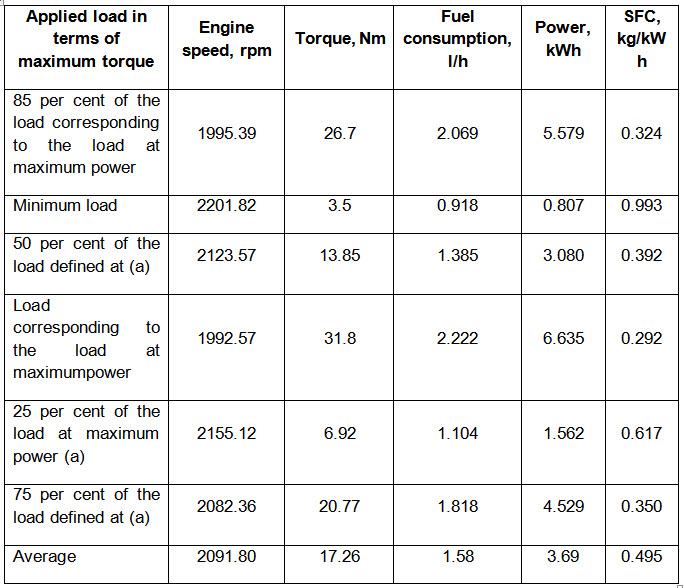
Table 11 Engine performance during variable load test of B100 at 2200rpm idle speed
31.2.3. Performance of biodiesel run power tiller under field condition
To measure the average fuel consumption rate of the power tiller engine during field operation, the field test of the power tiller was conducted. Fuel consumption for rotavator operation under dry soil condition was measured. The field trials were conducted at Eastern block of Tamil Nadu Agricultural University campus.
The power tiller engine was run in the field by marking a known distance and operated at three different Low speed gears viz., L- I, II & III. In each gear, the power tiller was operated for 45 minutes. The area covered, forward travel speed and time taken for tillage in each forward speed was recorded. The field test was run with B40 biodiesel blend and diesel fuel. The performance of the power tiller is tabulated in Table 11.13. The field view of the power tiller under test is given in Fig.15.
It was observed that the fuel consumption rate slightly decreased when the forward speed was increased from 1.5 to 2.13 km/h. However when forward speed was increased to 4.04 km/h (gear III) the fuel consumption was rapidly increased. The comparison of fuel consumption between D100 and B40 shows that the consumption of B40 fuel l/h was 17.2 per cent more than D100 at 1.5 km/h (I gear), While this value decreased to 15.74 per cent at 2.13 km/h (II gear) and 6.02 per cent at 4.40 km/h (III gear).
It is seen that as the speed is increased the fuel consumption per hectare is reduced from 7.68 at I gear to 4.1 l/ha at III gear for diesel fuel. The fuel consumption per hectare for B40 is 8.55 l/ha at I gear but reduced to 4.94 l/ha at III gear. This clearly shows that the fuel consumption per ha is 20 per cent more for B40 than diesel. The fuel consumption per hectare reduces rapidly when the forward speed is increased and confirming the “Gear-up throttle-down” strategy for enhancing fuel performance for power tillers.
Table 12 Fuel performance of power tiller engine in rotary tillage operation with D100 and B40 biodiesel blend
|
Gear selection |
D100 |
B40 |
||||||
|
Forward speed, km/h |
Area covered, ha/h |
Fuel consumption |
Forward speed, km/h |
Area covered, ha/h |
Fuel consumption |
|||
|
l/h |
l/ha |
l/h |
l/ha |
|||||
|
L-I |
1.5 |
0.151 |
1.16 |
7.68 |
1.58 |
0.159 |
1.36 |
8.55 |
|
L- II |
2.13 |
0.213 |
1.08 |
5.07 |
2.1 |
0.207 |
1.25 |
6.03 |
|
L- III |
4.04 |
0.405 |
1.66 |
4.1 |
3.56 |
0.356 |
1.76 |
4.94 |
31.2.4. Engine emission while operation with biodiesel blend
The Multi gas analyzer and Diesel Smoke tester were procured from M/s. Nevco Engineers, Chennai, Tamil Nadu. The specifications of the equipments are given below.
i) Flue Gas Analyser Model: KM 9106 (Quintox) – O2 (0-25%), CO 0-10%, CO2 (0-20%), CO/CO2 (Calculated) Make: M/s. Kane International Ltd., U.K. Optional: NO (0 - 5000 ppm), NO2 (0 - 1000 ppm), SO2 (0 - 5000ppm).
ii) Smoke meter – Diesel smoke tester Model: DS-2000; Make: Koen Co., Ltd, Korea. Range: 0.0 to 100%
In the present investigation the power tiller engine emissions were measured during the variable load test. The data recorded during each set of trail for different blends is given in Table 13 and is shown in Fig 16 to 19. The recording flue gas analyzer model KM 9106 of Quintox was used to measure the exhaust emissions. The particulate emission was measured using Koen DC-2000 model of Diesel smoke tester (smoke density meter).
(i) Carbon dioxide (CO2) emission
It is observed that D100 and B20 exhibit gradual increase of CO2 concentration in the 3 - 7 kW range. However B80 and B100 show a steep increase in the 3-4.5 kW range then drops by around 1%. It is interesting to note that the CO2% of all blends almost converges to a value of 7-8% at a load of 7 kW. From these patterns it can be concluded that up to about 50% of the rated load there is no significant difference between the blends in terms of CO2 concentration. Fuels with lesser biodiesel per cent show lesser CO2 emission at loads of 6-7 kW. The CO2 emission converges towards 7-8%.
(ii) Carbon monoxide (CO) emission
It is observed that there is no significant difference between D100 and B20 in terms of CO emission over the entire operating range. The B40, B60, B80 and B100 showed higher values of CO emission than D100 above 4 kW load. Higher concentration of CO in jatropha oil blended with diesel as compared to D100.
(iii) Oxygen emission
The residual O2 in the exhaust gas is linearly decreased from around 16% at 1kW to around 8% at 7 kW. The highest concentration of O2 is observed in blends with lesser biodiesel at a given power output. The air requirement for diesel fuel is lesser than biodiesel blends. The differences tend to reduce as the load reaches the peak value.
At part load operation, better performance can be obtained by ensuring higher air flow in biodiesel run engines.
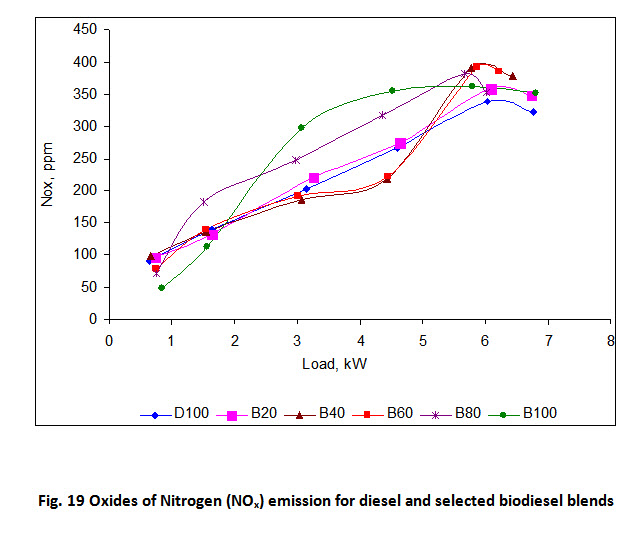
(iv) Oxides of Nitrogen emission
The NOx emission of D100 and B20 are almost identical and that of B40 and B60 are identical. The NOx values gradually increase from around 100 ppm at 1 kW to 300 ppm at around 7 kW. Except for B100 all other blends show all most linear increase in NOx in the 1 to 7 kW range.
Table 13 Exhaust gas emission of variable load test for diesel and biodiesel blends
|
Blends |
Loads |
O2, % |
CO2, % |
CO, % |
NO2, ppm |
NO, ppm |
NOx, ppm |
SO2 ppm |
|
D100 |
a |
10.5 |
8.2 |
0.141 |
5 |
334 |
339 |
64 |
|
b |
16.7 |
3.1 |
0.019 |
7 |
85 |
92 |
0 |
|
|
c |
15.0 |
5.7 |
0.017 |
6 |
197 |
203 |
5 |
|
|
d |
8.8 |
8.0 |
0.197 |
4 |
319 |
323 |
70 |
|
|
e |
15.7 |
5.4 |
0.015 |
7 |
132 |
139 |
1 |
|
|
f |
12.6 |
7.0 |
0.020 |
6 |
261 |
267 |
16 |
|
|
B20 |
a |
10.2 |
8.8 |
0.143 |
5 |
353 |
358 |
47 |
|
b |
16.2 |
3.5 |
0.024 |
7 |
90 |
97 |
0 |
|
|
c |
14.0 |
5.9 |
0.022 |
6 |
215 |
221 |
5 |
|
|
d |
8.9 |
8.5 |
0.200 |
4 |
336 |
348 |
52 |
|
|
e |
15.7 |
5.5 |
0.023 |
7 |
126 |
133 |
1 |
|
|
f |
12.0 |
7.2 |
0.024 |
5 |
269 |
274 |
16 |
|
|
B40 |
a |
10.3 |
8.6 |
0.137 |
1 |
390 |
391 |
28 |
|
b |
16.5 |
3.3 |
0.023 |
5 |
93 |
98 |
0 |
|
|
c |
13.8 |
5.9 |
0.024 |
1 |
186 |
187 |
1 |
|
|
d |
8.7 |
7.8 |
0.188 |
1 |
378 |
379 |
30 |
|
|
e |
15.1 |
5.6 |
0.022 |
3 |
134 |
137 |
0 |
|
|
f |
12.3 |
7.9 |
0.027 |
2 |
217 |
219 |
7 |
|
|
B60 |
a |
9.8 |
7.7 |
0.139 |
1 |
392 |
393 |
23 |
|
b |
16.3 |
3.5 |
0.022 |
3 |
76 |
79 |
0 |
|
|
c |
12.5 |
6.1 |
0.023 |
2 |
189 |
191 |
1 |
|
|
d |
8.7 |
7.5 |
0.185 |
1 |
384 |
385 |
23 |
|
|
e |
14.3 |
5.7 |
0.022 |
4 |
136 |
140 |
1 |
|
|
f |
11.8 |
8.3 |
0.25 |
2 |
220 |
222 |
4 |
|
|
B80 |
a |
9.7 |
7.5 |
0.145 |
2 |
379 |
381 |
19 |
|
b |
16.5 |
3.3 |
0.025 |
4 |
67 |
71 |
0 |
|
|
c |
11.7 |
5.8 |
0.024 |
2 |
245 |
247 |
2 |
|
|
d |
8.5 |
7.6 |
0.217 |
2 |
351 |
353 |
19 |
|
|
e |
13.7 |
5.9 |
0.023 |
3 |
179 |
182 |
1 |
|
|
f |
10.1 |
8.6 |
0.033 |
2 |
316 |
318 |
2 |
|
|
B100 |
a |
10.1 |
7.8 |
0.147 |
3 |
360 |
363 |
9 |
|
b |
16.2 |
3.4 |
0.027 |
4 |
45 |
49 |
0 |
|
|
c |
12.0 |
6.2 |
0.025 |
3 |
295 |
298 |
0 |
|
|
d |
8.8 |
7.8 |
0.223 |
3 |
348 |
351 |
13 |
|
|
e |
14.0 |
5.7 |
0.024 |
4 |
109 |
113 |
0 |
|
|
f |
10.6 |
8.5 |
0.037 |
3 |
352 |
355 |
1 |
a, 85 percent of the load corresponding to the load at maximum
b, Minimum load
c, 50 percent of the load defined at (a)
d, Load corresponding to the load at maximum power
e, 25 percent of the load at maximum power(a), and
f, 75 percent of the load defined at (a)
(v) Smoke density emission of exhaust gas
The smoke density of exhaust gas for diesel and selected biodiesel for the blends are plotted as a function of engine power in Fig.20.
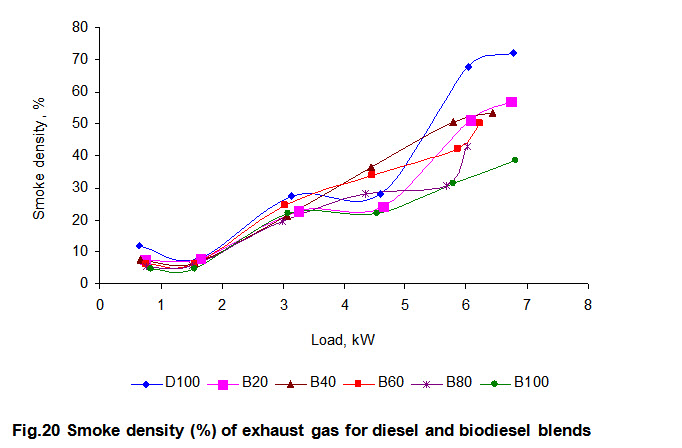
Table 14 Smoke density of diesel and biodiesel blends at various loads
|
Load / Blends |
D100 |
B20 |
B40 |
B60 |
B80 |
B100 |
|
85 per cent of the load corresponding to the load at maximum |
67.8 |
51.3 |
50.3 |
42.3 |
30.7 |
31.4 |
|
Minimum load |
12.0 |
7.5 |
7.5 |
6.1 |
5.3 |
4.7 |
|
50 per cent of the load defined at (a) |
27.3 |
22.8 |
21.1 |
24.5 |
19.5 |
21.9 |
|
Load corresponding to the load at maximum power |
72.1 |
56.9 |
53.4 |
50.1 |
43.0 |
38.6 |
|
25 per cent of the load at maximum power (a) |
7.9 |
8.0 |
6.51 |
6.2 |
5.7 |
4.8 |
|
75 per cent of the load defined at (a) |
28.1 |
24.0 |
36.3 |
34.0 |
28.2 |
21.9 |
The smoke density was found to increase with increase in load in almost linear pattern from 1 to 4.5 kW. In 4.5 to 7 kW, D100 showed rapid increase in smoke density while B100 showed minimum increase in smoke density. The correlation between low black smoke emission and high NOx concentration was also observed.
31.3. Performance evaluation of biodiesel blends in a variable compression test rig
31.3.1 Methodologies adopted
Variable Compression Ratio Multifuel Engine Test Rig procured from Legion Brothers, Bangalore (Fig. 6) was used for testing the engine performance and emission studies. The Engine specifications are given below in table 6.
Table 6. Specification of variable compression multifuel engine
|
BHP |
3 HP |
|
Speed |
1500 to 2000 RPM variable speed for SI operation, Governed speed for 1500 RPM for CI operation. |
|
Compression Ratio |
5:1 to 20:1 |
|
Bore; Stroke |
80 mm; 110 mm |
|
Type of Ignition |
Spark ignition (time adjustable 0 to 70 deg ATDC, 0 to 70 deg BTDC) or Compression ignition |
|
Method of Loading |
Eddy Current Dynamometer |
|
Method of Cooling |
Water |
To study engine performance, the compression ratios for diesel, biodiesel and their blends were selected as 14:1, 16:1, 18:1 and 20:1 and the load ranges were selected as no load, 2 k g, 4 kg, 6 kg and 8 kg as the engine used for this study having load range from no load to 8 kg load.
31.3.2 Performance evaluation results
The effect of different compression ratios, loads and blends on the engine performance and emission characteristics were studied in the form of Brake Power (BP), Specific Fuel Consumption (SFC), Brake Thermal Efficiency (BTE) and Heat Balance Chart (HBC). It was found out that BSFC was higher for Jatropha biodiesel (0.425 kg kWh-1) compare to diesel (0.350 kg kWh-1) but for B20 it was lower (0.340 kg kWh-1) than both biodiesel and diesel. The optimum compression ratio for Jatriopha biodiesel, B20 and diesel was found at 20:1, 18:1 and 16:1, respectively. The higher BTE was obtained for B20 and B40 (27.07 and 26.45 %) than other blends at compression ratio 18:1. The temperature of exhaust gas and heat input was increased with increase in percentage of Jatropha biodiesel and the maximum values were 559ºC and 43987.5 kJ h-1, respectively which were higher than diesel (519ºC and 29222.4 kJ h-1, respectively).
The CO2 emission was found to be higher for Jatropha biodiesel (9.2 %) than diesel (8.1 %). The reduced percentage of CO and SO2 was observed for all blends as compared to diesel at different loads. The SO2 emission of Jatropha biodiesel was found to be nil due to zero sulphur content and was higher for diesel (61 ppm). Due to the presence of higher oxygen molecule in Jatropha biodiesel, NOx emission was increased with increase in blend proportion of Jatropha biodiesel and was maximum for B100 (428 ppm) compared to diesel (413 ppm).
Last modified: Wednesday, 9 April 2014, 4:55 AM