

Site pages
Current course
Participants
General
Module 1: Watershed Management – Problems and Pros...
Module 2: Land Capability and Watershed Based Land...
Module 3: Watershed Characteristics: Physical and ...
Module 4: Hydrologic Data for Watershed Planning
Module 5: Watershed Delineation and Prioritization
Module 6: Water Yield Assessment and Measurement
Module 7: Hydrologic and Hydraulic Design of Water...
Module 8: Soil Erosion and its Control Measures
Module 9: Sediment Yield Estimation/Measurement fr...
Module 10: Rainwater Conservation Technologies and...
Module 11: Water Budgeting in a Watershed
Module 12: Effect of Cropping System, Land Managem...
Module 13: People’s Participation in Watershed Man...
Module 14: Monitoring & Evaluation of Watershe...
Module 15: Planning and Formulation of Project Pro...
Module 16: Optimal Land Use Models
Keywords
Lesson 9 Watershed Delineation
9.1 Concept of Topographic or Contour Map
A topographic map is a two-dimensional representation of a portion of the three-dimensional surface of the earth. Topography is the shape of the land surface, and topographic maps exist to represent the land surface.
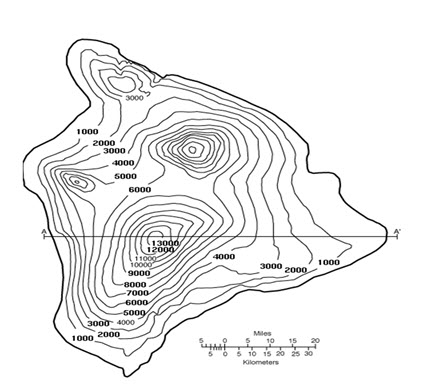
Fig. 9.1. A Typical Contour Map. (Source: http://volcano.oregonstate.edu/vwdocs/vwlessons/land_pics/a6.3.gif)
Cartographers solve the problem of representing the three-dimensional land surface on a flat piece of paper by using contour lines, thus horizontal distances and vertical elevations can both be measured from a topographic map (Fig. 9.1).
The terms used to indicate what information is contained on a topographic map are given below:
9.1.1 Map Scale: Maps come in a variety of scales, covering areas ranging from the entire earth to a city block (or less).
9.1.2 Vertical Scale (Contour Interval): All maps have a horizontal scale. Topographic maps also have a vertical scale to allow the determination of a point in three dimensional spaces.
9.1.3 Contour Lines: Contour lines are used to determine elevations and are lines on a map that are produced from connecting points of equal elevation (elevation refers to height in feet, or meters above sea level). The following are general characteristics of contour lines:
Contour lines do not cross each other, divide or split.
Closely spaced contour lines represent steep slopes, conversely, contour lines that are spaced far apart represent gentle slopes.
Contour lines trend up valleys and form a "V" or a "U" where they cross a stream.
Contour lines can not merge or cross one another on the map, except in the case of an overhanging cliff.
Contour lines can not end anywhere, but close on themselves either within or outside the limits of the map.
On most topographic maps, index contour lines are generally darker and are marked with their elevations. Lighter contour lines do not have elevations, but can be determined by counting up or down from the nearest index contour line and multiplying by the contour interval. The contour interval is stated on every topographic map and is usually located below the scale.
9.2 Watershed Boundary Delineation from Contour/Topographic Maps
Topographic maps; for example, have a scale of 1:24,000 (which means that one inch measured on the map represents 24,000 inches (2000 feet) on the ground). They also have contour lines that are usually shown in increments of ten or twenty feet. Contour lines represent lines of equal elevation, which typically is expressed in terms of feet above mean sea level. As you imagine water flowing downhill, imagine it crossing the contour lines perpendicularly.
9.2.1 Watershed Boundary Delineation from Contour/Topographic Maps
The water flow is perpendicular to contour lines. In the case of the isolated hill, water flows down on all sides of the hill. Water flows from the top of the saddle or ridge, down each side Fig. 9.2. As the water continues downhill, it flows into progressively larger watercourses and ultimately into the ocean. Any point on a watercourse can be used to define a watershed.
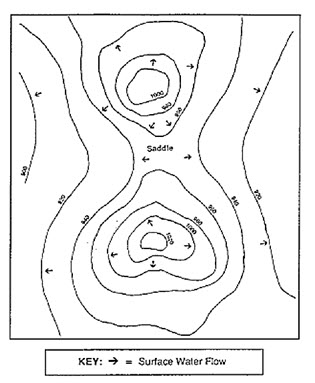
Fig. 9.2. Saddle. (Source: http://www.nrcs.usda.gov/wps/portal/nrcs/detail/nh/programs/planning/wsp/?cid=nrcs144p2_015706)
As one proceeds upstream, successively higher and higher contour lines first parallel then cross the stream. This is because the floor of a river valley rises as you go upstream. Likewise the valley slopes upward on each side of the stream. A general rule of thumb is that topographic lines always point upstream. In Fig. 9.3, for example, the direction of stream flow is from point A to point B. Ultimately, the highest point upstream is obtained. This is the head of the watershed, beyond which the land slopes away into another watershed. At each point on the stream the land slopes up on each side to some high point then down into another watershed. Join all of these high points around the stream to have the watershed boundary. (High points are generally hill tops, ridge lines, or saddles)
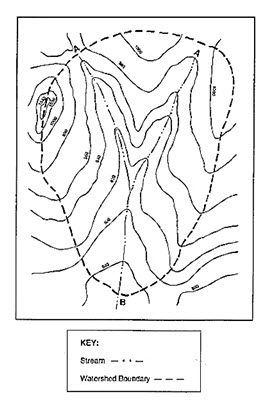
Fig. 9.3. Delineated Watershed Boundary. (Source: http://www.nrcs.usda.gov/wps/portal/nrcs/detail/nh/programs/planning/wsp/?cid=nrcs144p2_015706)
9.3 Geographic Information System (GIS) for Watershed Delineation
Aquatic resource managers increasingly require information about the characteristics of watersheds that drain to stream reaches of interest. Furthermore, they need this information for multiple watersheds within states or larger regions. Geographic information systems (GIS), coupled with increased spatial data availability, allow researchers to obtain this information. Information obtained from a GIS-based watershed analysis can include data such as watershed area, watershed climate statistics, soil/geology types, topographic statistics, hydrology, and land use.
Steps for using GIS to Delineate Watershed
9.3.1 Preparation of Digital Elevation Model (DEM)
Step 1: Scanning of Topographic Map (Contour Map)
Scan the contour map in high resolution and save it preferably in a *.TIFF file.
Step 2: Geo-referencing Scanned Map in ArcMap
The process of geo-referencing a raster map requires at least four known geo-coordinates.
Identify four coordinates and convert them to decimal points.
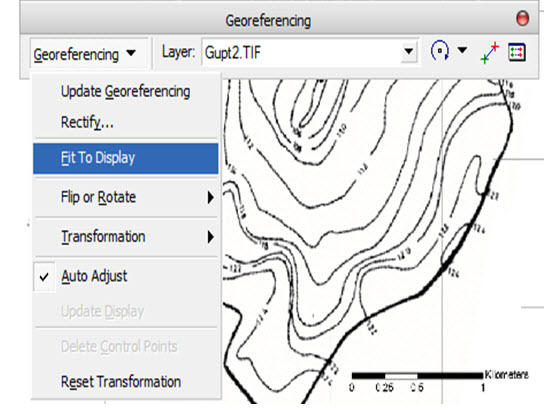
Use Geo-referencing toolbar in ArcMap for image rectification (geo-referencing).
Geo-referencing - Fit To Display.
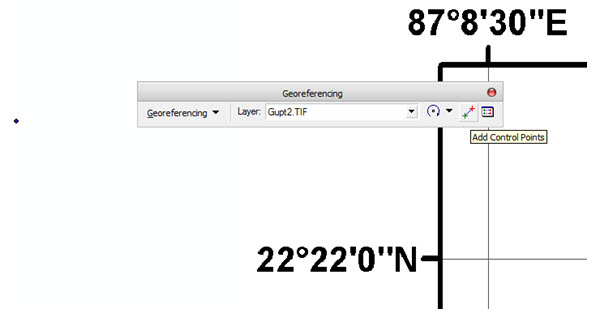
Zoom to first coordinate
Select Add Control points
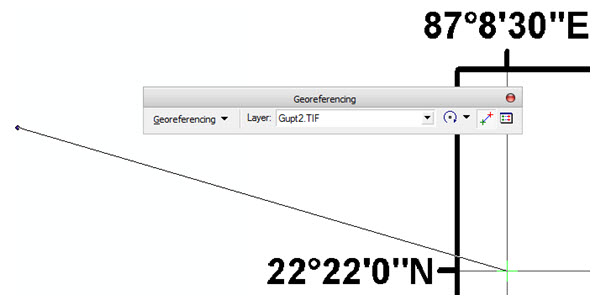
First click on coordinate in scanned map actual coordinate
Similarly complete this for other three points
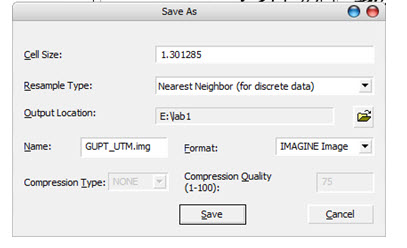
Save the rectified image in a different file (*.TIFF / *.IMG).
Geo-referencing Rectify
The rectified image can be reprojected to UTM WGS 84 system.
Step 3: Onscreen Digitization
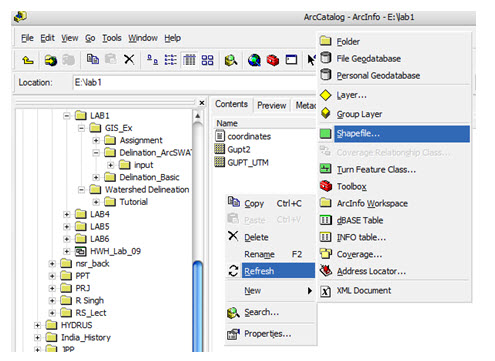
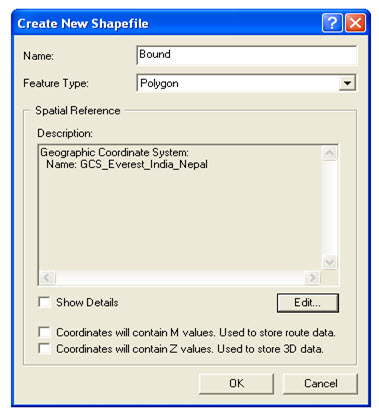
Boundary: Create a new shape file using ArcCatalog (say bound)
Select feature type as polygon and assign a spatial reference system to it.
Now, go to ArcMap and add this layer. Open Editor Toolbar in ArcMap.
Select the bound layer in TOC and click start editing. Now, digitize the boundary and save it. Then to stop editing, click stop editing.
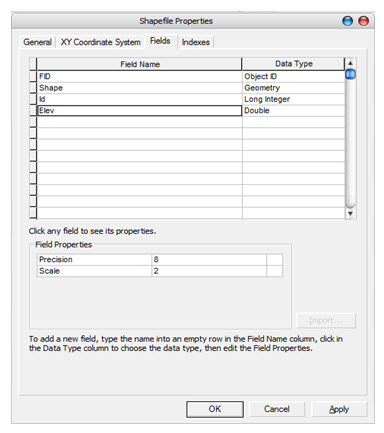
Contour line: Create another shape file (say count). This will be a polyline feature and assign a spatial reference system.
In ArcCatalog right click on the shape file, go to properties and add a new field (say elev) to provide contour elevation.
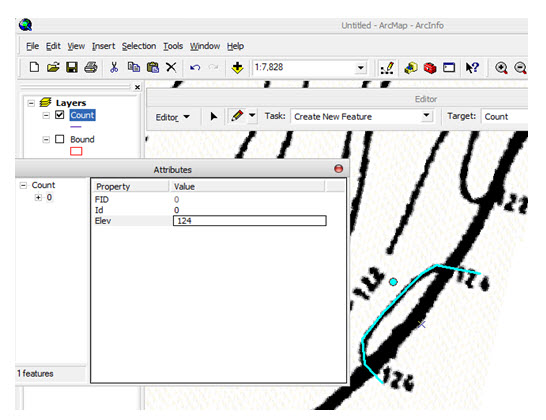
Now, digitize all the contours as mentioned above and enter elevation value to each contour in the elev field. Save it and to stop editing, click stop editing.
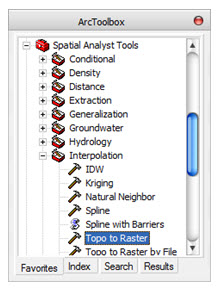
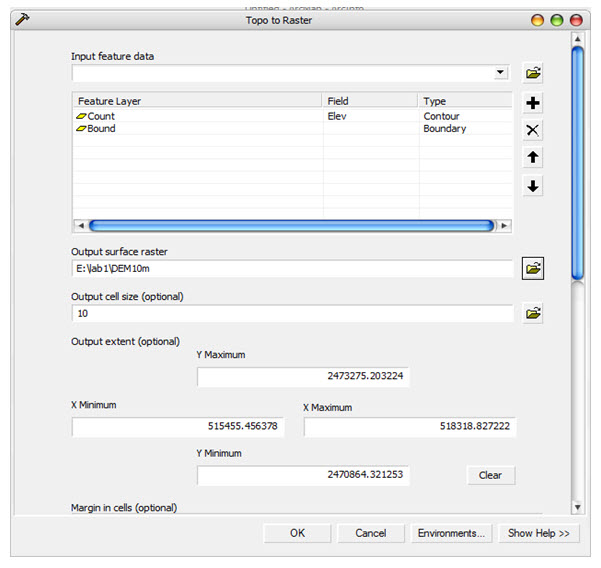
Step 4: DEM Creation (Interpolate to Raster)
Use Topo to Raster tool in ArcToolbox. This creates a hierologically correct raster of elevation.
In the input feature data, provide both the shape files (count and bound).
For count in the field change it to elev, and for bound change the type to boundary.
Locate the folder where output will be saved and provide required cell size in Output cell size option.
Press OK to create the DEM.
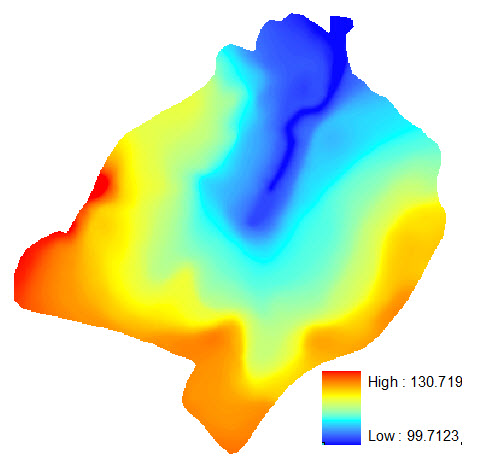
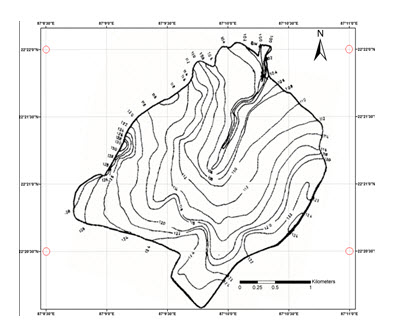
Final DEM may look like this
9.3.2 Steps for Delineating a Watershed using GIS based Model - ArcSWAT
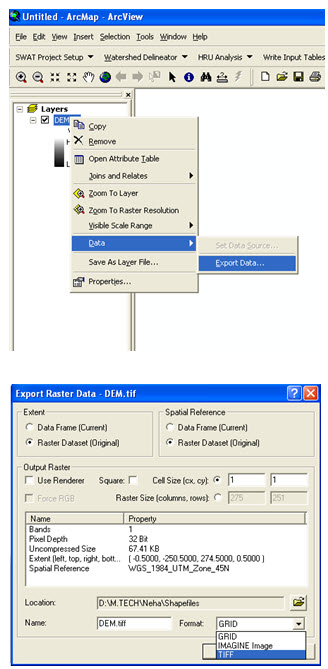
Step 1: Export the DEM from image (img.) file to TIFF file and save it again.
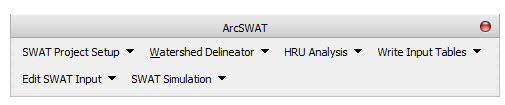
Step 2: Open the ArcSWAT toolbar
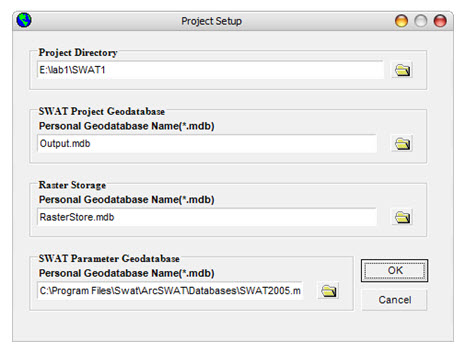
Step 3: Go to SWAT Project Setup, choose New SWAT Project to open the dialog below. Select a suitable project directory.
Step 4: Go to Watershed Delineator choose Automatic watershed delineator to bring the watershed delineation window. Load the DEM.tiff.
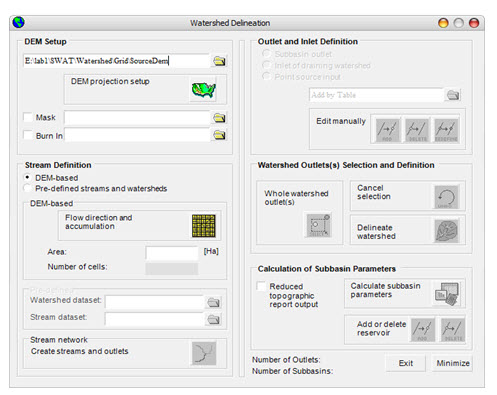
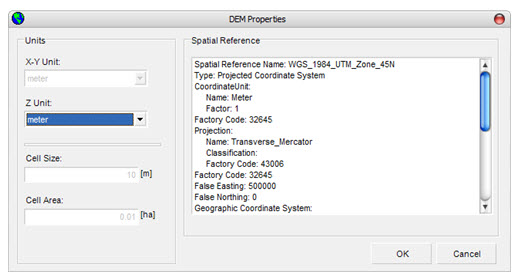
Step 5: In DEM projection setup set Z Unit to meter.
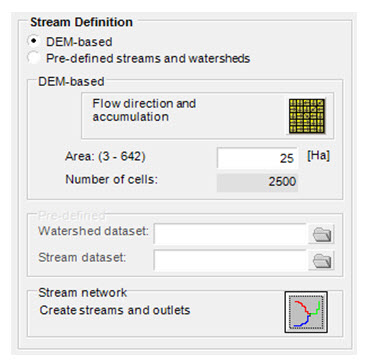
Step 6: Click on the flow direction and accumulation.
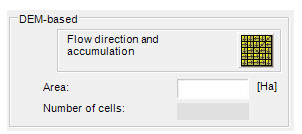
Step 7: Set min. area to 25 ha. (Greater than the threshold value) and create streams and outlets.
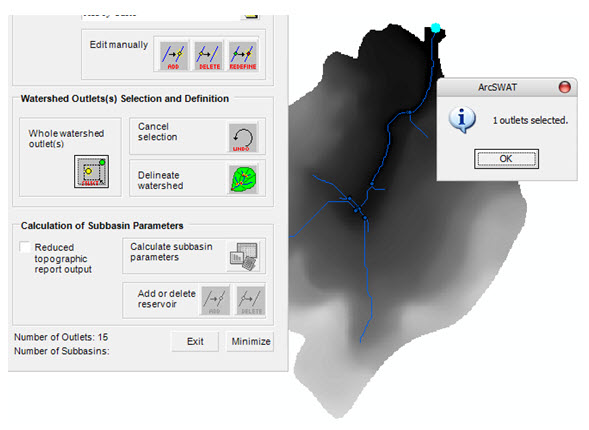
Step 8: If required change any outlet and Inlet definition. Then select the whole watershed outlets and choose Delineate watershed option.
9.4. Accuracy in Watershed Delineation
9.4.1 Spatial Data Accuracy
Do we simply get better results when using finer resolution source data e.g. DEM? At first, it may seem so, but consider high-resolution (let’s say 1m) LiDAR derived DEM. If we have a big road crossing a river in our watershed, it may appear as an elevated surface high enough to change watershed delineation result. Therefore it is sometimes necessary to burn-in existing streams. This process alters DEM such that no bumps on the river appear. While this feature is missing in Spatial Analyst/Hydrology tool, one can find it in more specialized hydrology extensions for GIS like ArcHydro and TauDEM.
9.4.2 Raster Data Resampling
During the work with GIS, one will often have to re-project the data in different coordinate systems. To get rid of unnecessary details in case when all other data has much lower resolution and excessive details just take space or vice versa, one may have just a single raster file with no-so-good resolution and certain GIS extension/plug-in would require equalizing spatial resolution. In all these procedures re-sampling is involved. That is interpolation of existing data. There are several re-sampling techniques available in most GIS. One should be aware of what kind of data is dealt with. If it is a land use data, that is when each grid cell is assigned an integer code, the new intermediate cells may be filled using nearest neighbor approach instead of calculating some average. However it is vice versa in case of DEM. One may not want to interpolate the DEM using nearest neighbor approach which is usually default but linear or cubic could become good choices. Unless categorical data (like land use) is used, make sure of using real values and not integers and apply smooth re-sampling.
9.4.3 Slope & Flow direction
Several algorithms exists to define flow direction and to choose single one with the steepest slope when each inner cell is surrounded by 8 adjacent cells.
D8? that simply chooses single cell among 8 adjacent cells. As a result, concentration to distinct lines happens. This is the only available algorithm in Spatial Analyst/Hydrology toolbox in ArcGIS.
D∞? calculates hypothetical flow direction and then splits flow between 1 or 2 adjacent cells based on how close directions to these cells are close to the hypothetical one. Still only single flow direction is chosen each time.
MD∞ ? similar to previous one, but allows flow in multiple directions, but as a result it all gets distributed between same 8 adjacent cells.
There are other algorithms, but they are not as widely spread as aforementioned. Some of them, like proportioning flow according to slope, generate unrealistic spread pattern.
Keywords: Watershed Delineation, Contour Map, Digital Elevation Model, Geographic Information System
References
www.nycswcd.ne
Neitsch SL, Arnold, JG, Kiniry JR, Williams JR (2005). SWAT theoretical documents version (2005) Grassland, soil and water research laboratory agricultural research services temple.
Suggested Reading
David, R. M. (2002). Arc Hydro: GIS for water resources. ESRI, Redlands.
Vieux, B. E. (2001). Distributed Hydrologic Modeling using GIS (pp. 1-17). Springer, The Netherlands.