Site pages
Current course
Participants
General
Module 1: Watershed Management – Problems and Pros...
Module 2: Land Capability and Watershed Based Land...
Module 3: Watershed Characteristics: Physical and ...
Module 4: Hydrologic Data for Watershed Planning
Module 5: Watershed Delineation and Prioritization
Module 6: Water Yield Assessment and Measurement
Module 7: Hydrologic and Hydraulic Design of Water...
Module 8: Soil Erosion and its Control Measures
Module 9: Sediment Yield Estimation/Measurement fr...
Module 10: Rainwater Conservation Technologies and...
Module 11: Water Budgeting in a Watershed
Module 12: Effect of Cropping System, Land Managem...
Module 13: People’s Participation in Watershed Man...
Module 14: Monitoring & Evaluation of Watershe...
Module 15: Planning and Formulation of Project Pro...
Module 16: Optimal Land Use Models
Keywords
Lesson 26 Case Studies in People’s Participation in Watershed Management
26.1 People’s Participation Case Study within India
The regeneration of Jhabua- a poor tribal district of Madhya Pradesh, situated on the border with Gujarat- is an outstanding effort by a state government to involve the people on a large-scale in integrated land and water management, probably the first of its kind in India. The state-wide programme was initiated in 1998 by Digvijay Singh, the then Chief Minister of Madhya Pradesh, after he was inspired by the work of social activist Anna Hazare in his village Ralegan Siddhi in Maharashtra.
In 1985, Jhabua was just a moonscape. Thirteen years later, the land was being nursed back to life with care. The programme, entitled the Rajiv Gandhi Mission for Watershed Development (RGMWD), started in 1994. Already, satellite imagery was showing changes in the number of water bodies and the extent of the green cover. Trees were beginning to grow and there was grass. Dug wells had water and were often overflowing. All these were in a place that was chronically drought-prone in the 1980s. It was the result of political will combined with eager participation of local communities.
Jhabua down the Ages
Jhabua is an upland region of western Madhya Pradesh. Once a heavily forested area, Jhabua lost its natural wealth over the last 45-50 years. Almost 80 per cent of its forest is severely degraded. Of this, more than 30 per cent of forest land was without any tree cover. The reasons are many and range from government-aided plunders by contractors to clearing up for agricultural activities and population pressure.
As the uplands were used for cultivation without terracing, the humus and fertile layer of soil was lost and soil erosion accelerated. Free grazing further affected the vegetative cover of the land. The district was dotted with rock-exposed hillocks. The intensive cultivation on uplands led to an ecological disaster, resulting in loss of land productivity, decline in employment opportunities, and distress outmigration of people.
Jhabua’s topography is undulating. There is rapid runoff in the district, which has an annual average rainfall of 830 mm. As such, post-monsoon water was almost non-existent. Moreover, there is wide variation in annual rainfall from year to year. This had resulted in extensive hill, gully and ravine soil erosion.
Both Jhabua and its adjoining areas in Dhar district were, thus, on the threshold of an ecological disaster, which spelt doom for the populace. The impact was greater on the tribal people as 83 per cent of the district’s populations were tribals, mostly Bhils, whose survival was closely linked to forests.
During 1966-68, Jhabua witnessed its first famine since independence. There was another severe drought in 1985 when Jhabua recorded only 308 mm of annual rainfall, the lowest since 1911. It also witnessed the first food riots after the 1947 Indian Independence. Migration out of Jhabua for jobs continued into the 1990s, ranging between 57-66 per cent. In almost all landholding categories, except large farmers, more than one-third of the household was migrating.
Rescue Mission
The situation changed in the mid-1990s, when the Madhya Pradesh government launched the RGMWD programme, in October 1994. A decentralized and time-bound mission, it started with the objective of improving 1.2 million hectares (mha) of the land stretched over several watersheds, by the year 2000, with each watershed project finishing within four years. It envisaged greening more than 2.9 mha — approximately one per cent of the country’s total land area — spanning 6,691 villages, through 5,024 watersheds [see Table 26.1].
Table 26.1. Mission Extensive (Source: Mahapatra, 2001)
No. of villages (i.e., vill.s) in undivided Madhya Pradesh under the Rajiv Gandhi Mission for Watershed Development
___________________________________________________________________________
1996-97 1997-98 1998-99 1999-2000
___________________________________________________________________________
EAS DPAP Tot. EAS DPAP Tot. EAS DPAP Tot. EAS DPAP Tot.
___________________________________________________________________________
Dist.s 42 25 NA 45 25 NA 61 25 61 61 31 61
Blocks 354 134 NA 419 134 NA 459 134 459 459 134 459
mWSs 488 165 653 585 165 750 624 173 797 624 173 797
μWSs 3,220 1,151 4,371 3,863 1,176 5,039 4,461 1,253 5,714 4,461 1,253 5,714
Vill.s 4,817 1,874 6,691 5,864 1,963 7,827 6,182 2,016 8,198 6,182 2,016 8,198
Note: EAS: Employment Assurance Scheme; DPAP: Drought-Prone Area Programme; mWS: Milli-watershed [5,000 to 10,000 ha.]; μWS: Micro-watershed [500 to 1,000 ha.]
1. Total Blocks & Districts covered under EAS and DPAP could not be ascertained as in some places the programmes were overlapping.
2. The figures for 1997-98 were upto Nov. 1998, since the Govt. changed the documentation process at that time.
By 2001, Jhabua had become a model district in watershed management. The mission had broken all rules. The people, instead of bureaucrats, were the decision-makers. The mission, introduced in the undivided state’s 61 districts, had also transformed the local economy. Approximately 14 million human-days of employment were created in Jhabua alone. Some 218 micro-waiersheds covered 124,000 hectares (ha) at an estimated cost of Rs 44.47 crore.
The mission’s guidelines, keeping in view its objectives, for selecting a watershed were:
Acute shortage of drinking water;
Soil erosion and poor water resources, causing a decrease in agricultural and biomass productivity;
Preponderance of wastelands;
Extensive land degradation;
Large population of Scheduled Castes and Scheduled Tribes dependent on watershed resources;
Actual wages lower than minimum wages; and,
A watershed that is contiguous to an earlier developed watershed.
Making All the Difference
What was different in this programme was the mode of implementation [see Table 26.2:]. In the 1ast 50 years, most programmes and schemes meant for the people had not included them. When the end-users were involved, the system simply did not work. In this watershed mission, attempts were made to put all the responsibility on the people, with the government working only as a facilitator it was time for the villagers to take over. Other factors that contributed to the success of the programme included coordination of the programme at all levels, financial systems that reached out to the people, and the integration of forest management into land and water management.
Table 26.2. Changing Times (Source: Mahapatra, 2001)
Conceptual change in watershed management
|
Lacunae in previous watershed management programmes |
How Rajiv Gandhi Mission for Watershed Development (RGMWD) tried to mend them |
|
Projects were implemented in an isolated and segmental manner by different departments. |
All watershed activities were put under RGMWD for a coordinated approach. |
|
Relief operations were ad hoc and did not include soil & water conservation (S&WC) –the region’s most important problem. |
All employment generating schemes focus on S&WC and seek to make them sustainable. |
|
There were no proper guidelines for implementing agencies on watershed design and planning. |
RGMWD decides the plans, designs with an area-specific approach and gives priority for indigenous knowledge. |
|
People were not consulted for their own needs and to determine what suits their land the most. |
People are the focal point of solving problems. |
Putting People First
The first and most important aim of the mission was to make the programme a totally people-oriented one. The people were involved in the concept, planning, implementation and maintenance of land and water conservation activities in their watershed areas.
For instance, the villagers play an active role in managing the funds provided for the watershed programme. Nearly 80 per cent of the funds for the programme were put in a bank account managed by watershed development committees made up of village people.
The mission experimented by greening the anti-poverty programmes, to regenerate the lost environment and also create jobs. It had its leadership in R Gopalakrishnan, a bureaucrat, who was the then coordinator of the Rajiv Gandhi Missions of the Madhya Pradesh government. His experience in Jhabua in the drought-stricken mid-1980s inspired him to look for a green anti-poverty system. In the late 1980s, he had read Towards Green Villages: A Strategy for Environmentally- Sound and Participatory Rural Development, a study prepared by the Centre for Science and Environment. The study had argued that the large investments that the country was making under rural employment programmes could greatly benefit the poor and improve the local economy if it was directed towards ecological regeneration activities under people’s control.
All watershed activities under various departments were pulled into one body in a major effort to convert community demand into action entailed:
Establishing multi-disciplinary coordinating structures at watershed, district and state levels to act as facilitators for community organizations;
Capacity building, planning and implementation and promoting community action processes;
Making rural people, the actors in the programme from planning and implementation to maintenance, monitoring and management for which necessary community institution at the village level were evolved;
Harnessing all available techno-scientific resources to support the decision-making process of the people;
Developing a ‘cascade’ approach to the idea of land and water conservation, whereby it was seen as a completely integrated group of soil conservation & water impounding structures, each drawing upon and adding to the other; and,
Involving people’s representatives and members of Panchayati Raj (i.e., local self-government) institutions.
Coordination at Various Levels
The institutional complexity of the programme was extraordinary. The programme created several tiers of institutions to promote a people’s movement for watershed management at the state, district and village level ¾ at the state level, for policy coordination; at district and mille-watershed level, for implementation and co-ordination; and, at the village level, to ensure that all villagers acquire an interest in the effort. These institutions helped deal with the lack of inter-departmental co-ordination and intra-village community tensions that mark all watershed programmes. Significantly, not one new bureaucrat was recruited or a new department created.
With the then Chief Minister’s secretary as the coordinator of the mission, RGMWD was given high executive status. This was indicative of the state government’s will in the mission, and was also a clever move to make all officials accountable to the Chief Minister’s Office.
At the district level, the collector was the mission leader, which again put all the officials under the highest authority at the local level. So the mission had introduced a single-command system from the top, while giving flexible powers to the commanding authority at the operational level. It was the political will at the highest level that has made possible a single-command structure at the government level, thus skirting bureaucratic turf battles before bestowing power on the people. Serious efforts were made to give local communities powers of decision-making and control over resources.
Integration with Joint Forest Management (JFM)
Combining the principles of joint forest management (JFM) and watershed treatment was a new approach that was adopted in Jhabua. The JFM-watershed treatment started in 1994, with the formation of 20 village forest committees, the executive body under JFM that was mandated to protect forests with the help of the forest department. An intensive JFM awareness programme was initiated in villages.
With the adoption of the JFM-watershed treatment combination, tree felling had reduced drastically. In 1992-93, 1,412 tribals were arrested for tree-felling. In
1994-95, it came down to 676 and, according to forest officials, it had declined even further. People believed that forest degradation is the root cause of their misery. While JFM had protected the forest, the watershed programme made land fertile and helped recharge groundwater. In November 1997, 22 gram panchayats (i.e., village governments) handed over 4,000 ha of village land to be declared as forest area for afforestation.
Of Jhabua’s total forest area, 60 per cent (i.e., 100,950 ha) was brought under JFM by the year 2000 and the 344 village forest committees covered 420 villages. The committees had 72,656 members, of which 43,953 were males and 29,703 were females. Ironically, more villagers were guarding the forests than forest guards - one forest guard and two villagers for every 1,000 ha.
Financial Arrangements
Rajiv Gandhi Mission for Watershed Development (RGMWD) was funded by both the state and the Central Government. According to Central government guidelines, all funds under the drought-prone area programme (DPAP), funded by both the state and Central government, and the Integrated Watershed Development Programme (IWDP), funded entirely by the Central government, were to be spent on watershed treatment. Similarly, 50 per cent of the funds from the employment assurance scheme (EAS) were earmarked for it, apart from sectoral funds at the district level, and Jawahar Rozgar Yojana (JRY) funds at the panchayat level [see Table 26.3: Financing the Future].
Table 26.3. Financing the Future (Source: Mahapatra, 2001)
Source of money received by the district government for watershed development
Employment Assurance Scheme Drought-Prone Area Prog. Integr. Watershed Dev. Prog.
Central Govt. State Govt. Central Govt. State Govt. Central Govt. State Govt.
80 % 20 % 50 % 50 % 100 % 0 %
According to the guidelines for watershed committees prepared by RGMWD, once watershed plan prepared by the watershed committee was sanctioned, the District Rural Development Authority (DRDA) would release 75 % of the total money to the committee. The rest is kept for administrative expenses of the project’s implementing agencies (PIA). The money was transferred into the account of the watershed committee and its secretary was the statutory operator. Every fortnight, the watershed committee would meet to take decisions about various watershed activities, with the consent of other villagers, who were also invited to the meetings. The committee would report on the progress of the activities to the PIA at the watershed level which in turn would report it to the mission leader at the district level. Expenses incurred on the activities were put before the gramsabha [i.e., village body] for its scrutiny.
The watershed committee maintained two accounts viz., the project account and the development fund account. The first was meant for the money released by DRDA, and it would provide the daily expenditure of the project. The second was a fixed deposit account, for which 10 per cent of the total project cost was set aside. This was for post-project maintenance of all assets created during the implementation of the project. When villagers volunteer labour, a part of the respective wage was also kept in this account.
Both the Central and state governments would send their share of the money to the zilla parishad (i.e., district council). The zilla parishad then would disburse the money in the following way for a standard project period of four years:
0.2 % was kept by the zilla parishad for its own administrative expenses and for training of PIAs;
20 per cent was given to PIAs (five per cent for training of watershed development committees, users’ groups, etc.; five per cent for community organization; five per cent for entry point activities; and, five per cent for administrative expenses of PIAs) and,
79.8 per cent was given to watershed development committees (WDCs), of which 75 per cent was for watershed treatment works and 4.8 per cent was for administrative expenses of WDCs with which they could engage a full-time secretary and two paid volunteers. In Jhabua, the total expenditure till mid-1998 was Rs 16.48 crore, which means a total expenditure of just Rs 1,104 per hectare. Of the Rs 16.48 crore, Rs 4.53 crore (about 30 per cent) was spent by the project implementing agencies. A substantial amount of Rs 4.53 crore - about 60 per cent was spent on what is called entry point activity, i.e., activities that help to build up the credibility of the government, community organization and on training and capacity building, all of which was necessary for good institution building and social mobilization at the village level. About Rs 11.95 crore was handled by the village watershed development committees, and went as direct investment into the watershed development work, a large part of which was spent as wages for the employment generated (see Fig. 26.2: Investment to prosperity – a ground reality).
Saving Schemes
The programme encouraged villagers to save a part of their wages as a Watershed Development Fund (WDF), for future use for the management of the watershed. This was a mandatory fund developed through 5 per cent contribution of the cost of all works on community land by all users, 10 per cent contribution of the cost of all works on private lands owned by non-Scheduled Caste and non-Scheduled Tribe villagers, and 5 per cent contribution of the cost of all works on private lands owned by Scheduled Caste and Scheduled Tribe villagers.
WDF was thus a fund that was developed from contributions from all members of all user groups of landowning people). Self-help groups (that is, groups of landless people) were not expected to contribute to this fund. WDF was to be used for the repair and maintenance of the soil and water conservation structures created under the programme after the project came to an end in four years. The fund was entirely controlled by the community and neither the panchayat nor the officials of the rural development department had any control over it. Withdrawals from the fund were jointly signed by the chairperson of the village watershed committee and a representative of the panchayat.
Savings were also encouraged through a gram kosh (i.e., village fund) for use by the village for collective activities as per the wishes of the community, and bairani kuldis (i.e., women’s thrift and credit groups), which women can use to help each other with soft loans. All WDFs of Jhabua together had Rs 0.48 crore (some 35 per cent of the total expenditure on the programme), all village funds together had Rs 0.42 crore (about 3 per cent of the total) and all bairani kuldis, with 17,297 members, had a total deposit of about Rs 2.44 crore (about Rs 1,400 per member or about 18 per cent of the total expenditure). In other words, the programme had not just resulted in an improvement of the local ecology, but also in an improvement of the collective and individual financial security of the local villagers.
Economic Gains from Ecological Wealth
Watershed development in Jhabua had greened the environment and improved the economic status of the people. Dramatic changes were seen in water availability, afforestation, agricultural production, food security, and fodder availability and migration rates. It had also empowered women.
Water Availability
The foundation of any watershed programme is water and soil conservation. In the case of Jhabua it meant arresting the water that would fall on the hill slopes instead of allowing it to carry away the precious topsoil. The water is collected in a way that it percolates into the land and recharges the groundwater. Wherever necessary, small tanks were made. Some 143 new tanks were built and the water table had risen by 0.64 m on an average in 19 micro-watersheds [see Fig. 26.1]. The irrigated area increased to 1,115 ha in 18 micro-watersheds studied, which was nearly double the irrigated area of 1994-95.

Fig. 26.1. Water Table Rise in Jhabua Dist., Madhya Pradesh. (Source: Mahapatra, 2001)
Afforestation
The protection of land in the watershed and planting of various species of benefit to the local people (like bamboo, amla and neem) had shown a 66 per cent reduction in wasteland area in 11 micro-watersheds. District officials estimated that over two million trees were regenerated. The regeneration rate was far more rapid as compared to lands where only joint forest management (JFM) programmes were implemented because the water conservation efforts increase soil moisture and, therefore, plant growth. In turn, there was a more rapid increase in economic return to the poor people involved in watershed management.
Agricultural Production
With increased irrigation, agricultural productivity was rising. In seven micro-watersheds studied, the cropped area had increased by seven per cent and the cropping intensity of the cultivated land was also rising. The rabi (winter crop) area had increased.
Food Security
Food availability had increased by one to about four months. Some 313 village-level grain banks were established to ensure timely availability of food grains on easy credit.
Fodder Availability
Possibly, the earliest benefit had come from rapid regeneration of grass and thus it increased fodder availability. Some estimates suggested a 5-6 times increase in grass from the regenerated lands. This change could be seen with the data from the Hathipahwa watershed, where work started in 1995-96. The watershed covered 231.26 ha area in Ambakhoda and Badkua villages. It covered village agricultural land, government forest land and government revenue land. Before the work started, the land had no vegetation. The six tanks in the watershed would rarely fill up. Villagers had to buy grass from markets in neighboring Gujarat. There was a regular seasonal stream of distress migration. But by the year 2000, with watershed management and stall-feeding of cattle, the people of the watershed could sell grass every year and seasonal migration had almost disappeared. The change had come in just three years simply from the economic benefits due to increased grass production. Apart from earning money from selling grass, villagers had started keeping better breeds. Villagers had got 14 high quality cows and buffaloes by the year 2000. Increased water availability had increased vegetable productions which are sold in the local market.
Money Lending and Migration
The watershed development programme was already having a substantial social impact. Dependence on local moneylenders had gone down. A study of select micro-watersheds revealed that loans from moneylenders had gone down by 22 per cent. Distress migration has reduced considerably.
Looking Ahead
Some of the main issues that arose in the context of Jhalbua’s success were:
What would happen after the government withdraws the Mission along with its funding?
What about power conflicts among bureaucrats of government departments/ programmes and elected representatives?
What would happen when the forest grows enough to affect grass production?
Is Jhabua replicable?
Does watershed development stand the test of drought?
One of the main concerns was what would happen after the mission withdraws and the community takes over the job of maintaining the watersheds. Past experience had shown that many successful programmes had failed once they were totally entrusted to the people, because of inherent flaws in making them sustainable. Will the past repeat itself in Jhabua? Once the officials and the PIAs withdraw, the age-old problem of linkage between government and people would likely to crop up.By the year 2000, people would seek the Project Implementation Authority (PIA) officials’ help for sanctioning money or checking technicalities. As many as 17 account books were to be maintained in a single watershed unit by the local people, most of whom were illiterate. It would not be practical to maintain so many account books. However till the year 2000, the government had ensured that the success would continue. Grassroot organizations that were non-political and thus had credibility among the villagers were formed. These would serve as pillars of watershed activities. When the government was planning a national programme on watersheds, this institution building was given priority and as Madhya Pradesh has shown, the institutions had proved to be effective.
The panchayat (i.e., local government) institutions were facing parallel power centres. To avoid conflict, district authorities had made many gram panchayat (i.e., village government body) members as watershed committee secretaries. However, the usual conflict between the two power centres would be expected there regarding the ownership.
As fodder had been given importance as an economic and area-specific need, doubts arose about what would happen when the forest grows enough to affect grass production and whether this would not affect the cattle. Officials said it would not because, with the availability of fodder the people would prefer more productive cattle than many non-yielding animals. It would bring down the demand for fodder and compensate for the decline in grass production.
The 1999 monsoon failure was a good testing ground to evaluate watershed programmes in the face of drought. Jhabua proved that good watershed programmes can withstand monsoon failures.
The people involved in making Jhabua a success were confident that this programme would be sustainable. This confidence stemmed from the fact that the mission had made sure that the institution of the watershed committee and other supplementary organizations such as women’s banks became new power centres for people at the lowest level. Once people saw the benefits, it would be very hard to see the programme failing.
By the year 2001, Jhabua towered over other efforts and it was up to the people if they want to continue to reap benefits of good land and water management. And it was up to other states, if they want to follow the example of Madhya Pradesh.
26.2 People’s Participation Case Study outside India
Redeeming Negev’s Heritage in Israel
The Negev desert in Israel was uncultivated for 1,300 years from the 7th century AD onwards, until Israeli scientists reconstructed the ancient agricultural farms during the 1950’s harvesting the area's meagre annual average rainfall of 100 mm. Trees and plants that used to be raised in the Negev in the past were once again raised successfully.
The Negev is situated in the south of the country and covers an area of 1.25 Mha. Summers are hot and dry, extending over 7-8 months from March to October, while the winters are cool. Rainfall is sporadic and irregular, varying from 25 mm in a drought year to over 200 mm in a good year.
The Negev was densely settled by the Israelites under Solomon and the Judean kings in 1000 BC, marking the beginning of a period when desert agriculture flourished. It came to an end in the 6th century BC. The Negev was deserted until the 3rd century BC when the semi-nomadic Nabateans came from southern Arabia and settled there. They brought merchandise from India, Greece, Rome and built fortresses and cities at Avdat, Shivta and other places in the Negev to protect their trade routes. They practised agriculture around these cities to supply food to passing caravans, reusing the remains of old Israelite farms. In 106 AD, the Romans occupied the Nabatean empire, but agriculture in Negev continued to flourish.
Maximizing Meager Resources
Farmers in ancient times used a technique called runoff farming which made it possible for them to cultivate the desert with only 100 mm of rainfall. The soil of the Negev has the property of clogging and forming a thin crust on the surface as soon as it gets wet, turning impermeable to water almost immediately. As a result, the initial infiltration rate of 17-18 mm/h soon drops to 2-3 mm/h. When the precipitation is more than 3 mm/h, the excess water flows over the soil surface as runoff, which is then used for irrigating the crops.
The intensity of rain is more important than the amount of rain to create a runoff. A cultivated plot needs a catchment area 20-30 times its own size to get enough runoff for growing one crop. For example, consider the annual rainfall to be 100 mm and the catch ment is 20 times larger than the cultivated plot. If 75 per cent rainfall is lost due to infiltration and evaporation and only 25 per cent runoff is actually generated, then the plot receives 20 x 25 = 500 mm of runoff, in addition to 100 mm of direct rain. This quantity of water is enough for one cropping season.
Depending upon prevailing conditions, three different water harvesting systems were constructed on dry river beds known as wadis. In its simplest form, the wadi was divided into a series of terraces by building horizontal stone walls across it. These terraces retained part of the flood water and the excess amount flowed into successive fields below [see Fig. 26.2].
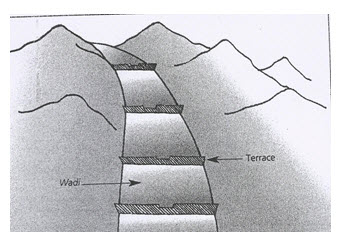
Fig. 26.2. Terraces for Harvesting in Negev Desert, Israel. (Source: Gogte, 2001)
In the second system, where terraces were unable to withstand the strong river currents, diversion dams were built across the river bed to raise the water level high enough to enter adjoining channels, leading to terraced fields built on adjacent floodplains.
The third and the most common method of rainwater harvesting was the conduit channel system, linking a group of terraced, cultivated fields to their catchment areas located on the slopes of surrounding hills. The terraced fields were normally located on the beds of small tributaries, dispersions or floodplains. The slopes had channels which ran diagonally along the hillsides and emptied the runoff into the fields [see F ig. 26.3].
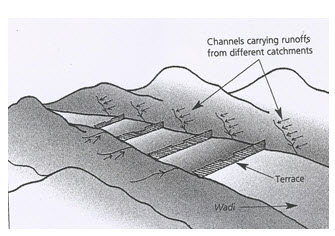
Fig. 26.3. Channel Networks and Terraces in Negev Desert, Israel.
(Source: Gogte, 2001)
Terrace walls were 300-500 mm high and built with 2-3 rows of stones. The distance of one wall from another was about 15 m, which also defined the size of the terrace. The stone walls had spillways to carry excess water downstream. The spillways had stone staircases which led the water to the lower terraces without causing erosion.
The depth of soil in the fields was 2-3 m. When the fields were flooded, water stood at 300 mm over the surface and then infiltrated into the soil within 2-3 days. Experiments have shown that 1mm of water is able to wet up to 8-10 mm depth of soil. Thus, a 300 mm of water column would suffice to saturate 2-3 m of soil in terraced fields which is sufficient to grow crops.
Traces of the old agricultural practices can still be seen in the Negev. The hills here were covered with stones and prevented the formation of a complete crust when it rained. Besides, the stones retained some water which then infiltrated into the soil. These stones were deliberately collected together to either strengthen the channels or heap them into mounds which are still visible in some areas. This also helped to increase the runoff once the catchment area was cleared of stones.
Inhabitants of the Negev built several cisterns to store drinking water for themselves and their livestock. One or more channels from the neighbouring hills would lead the runoff water into each cistern. Before entering a cistern the channels would open into a basin which collected part of the silt and dirt carried by the water. The cisterns were covered to protect them from pollution and evaporation. These cisterns are still recognizable in the desert, identified by the high mounds with loose white silt along their sides that give evidence of past cleaning operations of the cisterns.
Restoring a Shattered Visage
Israeli scientists, led by Michael Evenari, botanist and desert ecologist at the Hebrew University in Jerusalem, reconstructed two ancient farms at Shivta and Avdat in 1960, to understand the ancient systems of agriculture and how these could be adapted to suit present needs.
The farm at Shivta was reconstructed using the layout and water distribution system of the original Nabatean farm . Only those trees were planted which were grown by farmers in ancient times, as mentioned in the documents dated between 7th century AD and 8th century AD. These included almonds, pistachios, figs, grapes, carobs, apricots, peaches and plums.
Avdat, on the other hand, was an experimental farm with the objective of testing new crops, increasing yield and widening the application of runoff farming. As the water entering the fields was to be accurately measured and controlled, a modern floodwater distribution system was superimposed over the ancient system. In Avdat, trees were selected on the basis of their resistance to drought. Besides the trees grown at Shivta, cherries, apples and loganberries were also cultivated. The trees grown in the 7th and 8th centuries in the area fared better. The field crops that were tested in Avdat included wheat, barley, peas for seed production, sunflower and onion bulbs. Among the fodder plants, best results were obtained from alfalfa (Medicago sativa ), Harding grass (Phalaris tuberosa ) and Smilo grass (Oryzopsis miliacea). The perennial salt bush (Atriplex halimus) was also found to be well suited to runoff farming.
Small is Better
During the experiments at Avdat, it was discovered that smaller the catchment area, larger would be the runoff collected per m2 of catchment area. During one of the floods, measurements showed that a catchment of 340 ha produced 1,238 m3 of runoff or 3.6 m3/ha, whereas a 3ha catchment produced 156 m3 of runoff or 52 m3/ ha.
This is because in a large area where the runoff has to travel over long distances, more water was lost due to depressions, stones and other irregularities, resulting in increased infiltration and evaporation losses. This gave the scientists the idea that each tree or bush could have its own independent catchment called micro-catchment [see Fig. 26.4].
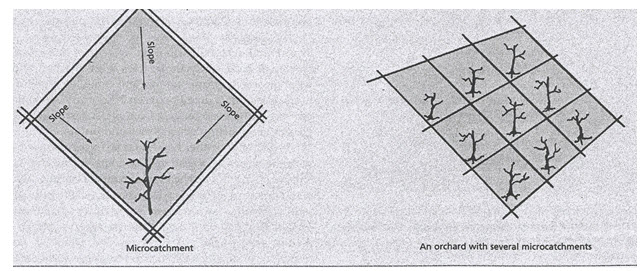
Fig. 26.4. Micro-catchments developed for macro-yields in Negev Desert, Israel. (Source: Gogte, 2001)
Micro-catchments between 15.6-1,000 m2 in size were constructed with an earthen border 200 mm in height. A square basin was dug at the lowermost point to collect the runoff from the micro-catchment where a tree or a bush was planted. The basin had to be dug up after every flood for aeration. The optimal microcatchment size [in m2] for fruit trees, grape vines and salt bush was 250, 62 and 32 respectively.
Micro-catchments offer many advantages. Being small in size, they do not suffer from water loss due to evaporation and uncontrolled percolation that larger catchments witness. The amount of water collected in micro-catchments can account for up to 62 per cent of the total rainfall. Even low intensity rains generate runoff in micro-catchments and while large catchments have only one runoff, these can generate up to eight runoffs. The cost of installing and maintaining a micro-catchment is also very low as no channels, terraces or stone fences are required. Even flat areas can have micro-catchments. These can also help to bring saline soil under cultivation, as runoffs are large enough to leach the soil in 1 to 2 years. Though the micro-catchment technique was developed independently in Israel, it was a surprise for Israeli scientists to discover later that farmers in southern Tunisia were traditionally growing olives in micro catchments, a technique probably introduced there by Phoenicians who had built the Carthage in 814 BC.
Keywords: Milli-watersheds, Micro-watersheds, Joint forest management, Ecological wealth, Migration from rural areas.
References
Mahapatra, R. (2001). Jhabua: A Green Miracle, In ‘Making water everybody’s business’ [Ed: Agarwal, A, Narain, S. and Khurana, I.], pp. 107-116, Centre for Science and Environment.
Gogte, A. (2001). Redeeming Negev’s Heritage, In ‘Making water everybody’s business’ [Ed: Agarwal, A, Narain, S. and Khurana, I.], pp. 186-188, Centre for Science and Environment.
Suggested Reading
Appan, A. (2001). Glimmers of Hope, In ‘Making Water Everybody’s Business’ [Ed: Agarwal, A, Narain, S. and Khurana, I.], pp. 183-185, Centre for Science and Environment.