

Site pages
Current course
Participants
General
Module 1. Role of mechanization and its relationsh...
Module 2. Performance and power analysis
Module 3. Cost analysis of machinery- fixed cost a...
Module 4. Selection of optimum machinery and repla...
Module 5. Break-even point and its analysis, relia...
Module 6. Mechanization planning
Module 7. Case studies and agricultural mechanizat...
Topic 8
Topic 9
Topic 10
Lesson 28 to 32
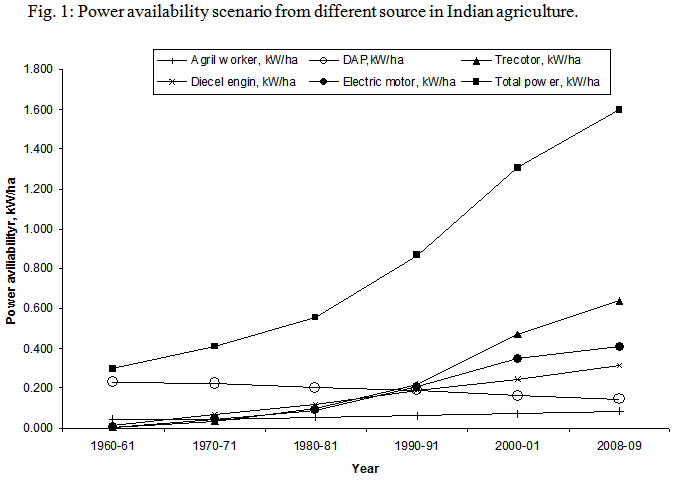
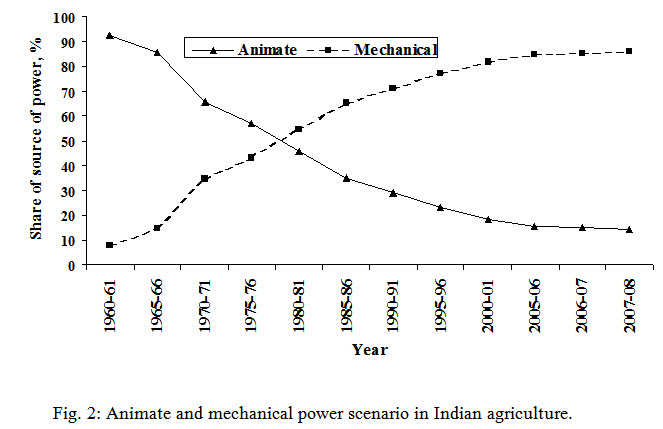
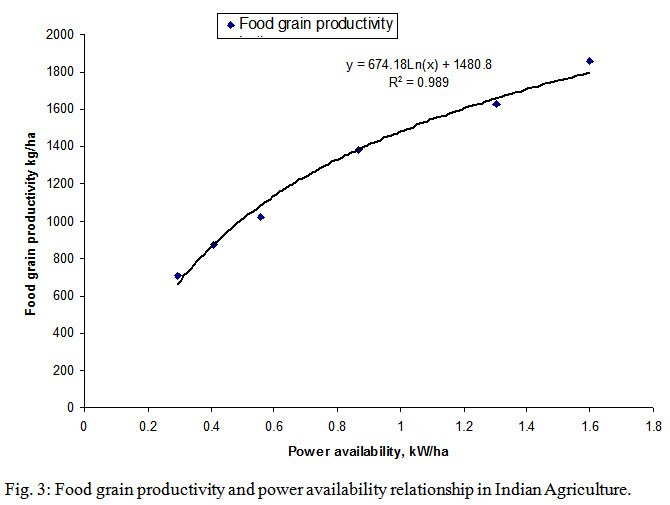
Between 1960 and 2010, the growth rate in power in Indian farms was 3.5 per cent and reached to 1.60 kW/ha (Fig. 1). In 1960-61 major contribution (92.31%) in farm power was from animate power (human + draught animal), where as in 2008-09 the major share was that of mechanical and electrical power (85.30%), Fig. 2. Over the years the contribution of animate source of power, especially that of draught animals, has been going down drastically. This shows that the additional need of farm power is being met through mechanical and electrical sources of power. This trend is going to continue in future also. For adoption of higher level of technology to perform complex operations within time constraints and with comfort and dignity to the operators, mechanical power becomes essential. Thus, the extent of use of mechanical power serves as an indicator of acceptance of higher level of technology on farms. Food grains productivity in India has increased from 0.710 t/ha in 1960-61 to 1.856 t/ha in 2008.09, while farm power availability has increased from 0.296 kW/ha to 1.600 kW/ha during the same period. Thus, food grains productivity is positively associated with unit power availability in Indian agriculture (Fig. 3). The relationship between food grains productivity and unit farm power availability for the period 1960-61 to 2008-09 were estimated by log linear function, with highly significant value of coefficient of determination (R2 ) as following:
Yfgs = 674.18 Ln(Xps) + 1480.8
R2 = 0.989
Where,
Yfgs = food grains productivity of India, kg/ha, and
Xps = power availability in India, kW/ha
This indicates that productivity and unit power availability is associated linearly. It is also evident that farm power input has to be increased further to achieve higher food grains production, the composition of farm power from different sources to be properly balanced to meet its timely requirement for various farm operations.
Some Calculations
Q. No. 1: Find out optimum tractor power required for draw bar operation and transportation for paddy wheat crop rotation in light soil for field of area of 10 ha.
FC% = 25.84 , U = 0.7, H = 8 h/day, Pt = 9400 Rs/kW
|
Crop |
Implement |
A (ha) |
E (kWh/ha) |
r |
n |
K |
Y |
V |
Sc |
Nt |
|
|
Paddy |
Disc Harrow |
10 |
6.187 |
0.5 |
2 |
0.00625 |
51.98 |
500 |
4 |
2 |
4.713 |
|
|
Cultivator |
10 |
3.324 |
0.5 |
2 |
0.00625 |
51.98 |
500 |
4 |
2 |
2.536 |
|
|
Planker |
10 |
3.037 |
0.5 |
2 |
0.00625 |
51.98 |
500 |
4 |
2 |
2.317 |
|
Wheat |
Disc Harrow |
10 |
6.187 |
0.5 |
2 |
0.00456 |
43.42 |
580 |
4 |
2 |
3.631 |
|
|
Cultivator |
10 |
3.324 |
0.5 |
2 |
0.00456 |
43.42 |
580 |
4 |
2 |
1.953 |
|
|
Planker |
10 |
3.037 |
0.5 |
2 |
0.00456 |
43.42 |
580 |
4 |
2 |
1.785 |
|
|
Seed Drill |
10 |
1.248 |
0.5 |
1 |
0.00456 |
43.42 |
580 |
2 |
1 |
1.158 |
|
|
Total 18.093 |
||||||||||
Power required for transportation of material for Paddy – What rotation
|
Crop |
W (t/ha) |
A(ha) |
Distance (kM) |
Labour (Rs/h) |
r |
(100x 0.27 x Dis x W x A x Labour)/(FC% x Pt x r) |
|
Paddy |
7.44 |
10 |
10 |
10 |
0.4 |
2.071 |
|
Wheat |
5.765 |
10 |
10 |
10 |
0.4 |
1.579 |
Optimum tractor power requirement, P = [18.093+2.071+1.579]1/2 = 4.663 kW
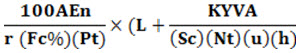
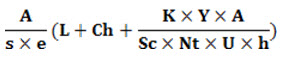
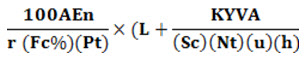
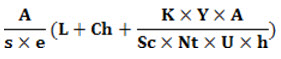
Q. No. 2: Find out the least width of disc harrow, cultivator, planter & seed drill in light soil for Paddy wheat rotation. Given Fc% of disc harrow, cultivator & planker is 24.2% and FC% for seed drill = 23.09%, P = Price of implement per unit width
|
Implement |
|
|
Width (m) |
|
|
Paddy |
Wheat |
|||
|
Disc Harrow |
0.00416 |
185.89 |
132.77 |
1.151 |
|
Cultivator |
0.0187 |
154.91 |
110.64 |
2.228 |
|
Planker |
0.0206 |
185.89 |
132.77 |
2.566 |
|
Seed Drill |
0.00614 |
0 |
312.40 |
1.385 |
Q. No. 3: Find out optimum trator power required for drawbar operations for cotton wheat crop rotation in light soil. FC% = 25.8%, U=0.7, H=8 hr/day, Pt = 9400Rs./kW
|
Crop |
Implement |
A (ha) |
E (kWh/ha) |
r |
n |
K |
Y |
V |
Sc |
Nt |
|
|
Wheat |
Disc Harrow |
10 |
6.187 |
0.5 |
2 |
0.00456 |
43.42 |
580 |
4 |
2 |
3.631 |
|
|
Cultivator |
10 |
3.324 |
0.5 |
2 |
0.00456 |
43.42 |
580 |
4 |
2 |
1.953 |
|
|
Planker |
10 |
3.037 |
0.5 |
2 |
0.00456 |
43.42 |
580 |
4 |
2 |
1.785 |
|
|
Seed Drill |
10 |
1.248 |
0.5 |
1 |
0.00456 |
43.42 |
580 |
2 |
1 |
1.158 |
|
Cotton |
Disc Harrow |
10 |
6.187 |
0.5 |
2 |
0.0351 |
2.05 |
2200 |
4 |
2 |
2.434 |
|
|
Cultivator |
10 |
3.324 |
0.5 |
2 |
0.0351 |
2.05 |
2200 |
4 |
2 |
1.309 |
|
|
Planker |
10 |
3.037 |
0.5 |
2 |
0.0351 |
2.05 |
2200 |
4 |
2 |
1.197 |
|
|
Planter |
10 |
1.645 |
0.5 |
1 |
0.0351 |
2.05 |
2200 |
2 |
1 |
0.889 |
|
|
Total 14.346 |
||||||||||
Optimum tractor power requirement, P = [14.346+0.225+1.579]1/2 = 4.020kW
Power required for transportation of material for cotton – What rotation
|
Crop |
W (t/ha) |
A(ha) |
Distance (kM) |
Labour (Rs/h) |
r |
(100x 0.27 x Dis x W x A x Labour)/(FC% x Pt x r)
|
|
Cotton |
0.809 |
10 |
10 |
10 |
0.4 |
0.225 |
|
Wheat |
5.765 |
10 |
10 |
10 |
0.4 |
1.579 |
ptimum tractor power requirement, P = [14.346+0.225+1.579]1/2 = 4.020kW
Q. No. 4: Find out the least cost width of farm implements in light soil for cotton wheat rotation. FC% of disc harrow, cultivator planker = 24.2% FC% for seed drill = 23.19% p= price of implement per unit width
|
Implement |
|
|
Width (m) |
|
|
Wheat |
Cotton |
|||
|
Disc Harrow |
0.00416 |
132.701 |
73.996 |
0.927 |
|
Cultivator |
0.0187 |
110.584 |
61.664 |
1.795 |
|
Planker |
0.0206 |
132.701 |
73.996 |
2.066 |
|
Seed Drill |
0.00614 |
312.237 |
- |
1.384 |
|
Planter |
0.00586 |
- |
198.982 |
1.079 |
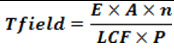
Q. No. 5: Find out the time for drawbar operation and transportation in heavy soil for cotton wheat rotation for field of 10 ha. Consider distance for transfer rotation=10 km and r= 0.8
|
Crop |
Implement |
A(ha) |
N |
E (kWh/ha) |
P (kW) |
LCF |
VW (t/ha) |
|
|
|
Wheat |
Disc Harrow |
10 |
4 |
6.178 |
4.389 |
0.5 |
5.67 |
112.59 |
43.63 |
|
|
Cultivator |
10 |
3 |
3.324 |
4.389 |
0.5 |
- |
45.43 |
- |
|
|
Planker |
10 |
4 |
3.037 |
4.389 |
0.5 |
- |
55.36 |
- |
|
|
Seed Drill |
10 |
1 |
1.248 |
4.389 |
0.5 |
- |
5.68 |
- |
|
Cotton |
Disc Harrow |
10 |
3 |
6.178 |
4.389 |
0.5 |
0.81 |
84.45 |
6.22 |
|
|
Cultivator |
10 |
8 |
3.324 |
4.389 |
0.5 |
- |
60.58 |
- |
|
|
Planker |
10 |
3 |
3.037 |
4.389 |
0.5 |
- |
41.52 |
- |
|
|
Planter |
10 |
1 |
1.645 |
4.389 |
0.5 |
- |
7.49 |
- |
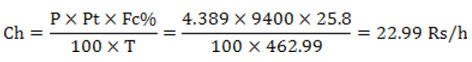
Total Tractor running time in h/year, T = 462.99 h
The cost of Power per hour can be calculated as
Last modified: Tuesday, 25 March 2014, 4:57 AM