Site pages
Current course
Participants
General
Module- 1 Engineering Properties of Biological Mat...
Module- 2 Physical Properties of Biomaterials
Module- 3 Engineering Properties
Module- 4 Rheological Properties of Biomaterials
Module- 5 Food Quality
Module- 6 Food Sampling
Module- 7 Sensory quality
Module 8. Quality Control and Management
Module 9. Food Laws
Module 10. Standards and regulations in food quali...
Lesson 32. Sanitation in food industry
Lesson 16. Colour measurement methods
Colour is an important quality attribute in the food and bioprocess industries, and it influences consumer’s choice and preferences. Food colour is governed by the chemical, biochemical, microbial and physical changes which occur during growth, maturation, postharvest handling and processing. Colour measurement of food products has been used as an indirect measure of other quality attributes such as flavour and contents of pigments because it is simpler, faster and correlates well with other physicochemical properties.
Colour Systems (Colour Spaces)
The colour of an object can be described by several colour coordinate systems. Some of the colour systems used in the food industries are munshell colour system, RGB system, Hunter L a b, Commission Internationale de l’Eclairage’s (CIE) L*a*b*, CIE XYZ, CIE L*u*v*, CIE Yxy, and CIE LCH. These differ in the symmetry of the colour space and in the coordinate system used to define points within that space.
Tristimulus colour values:
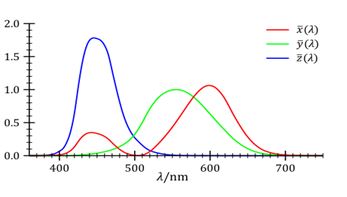
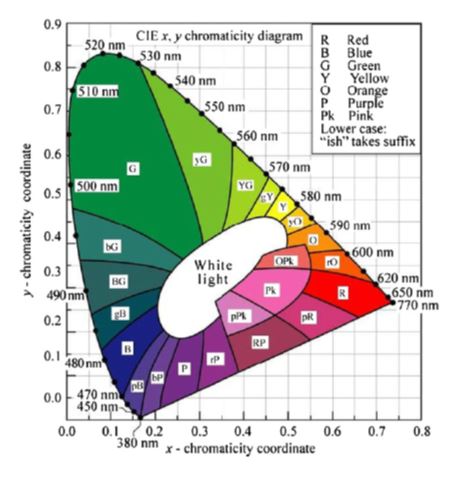
According to CIE concepts, the human eye has three colour receptors—red, green and blue—and all colours are combinations of those. The amounts of red, green and blue needed to form any particular colour are called the tristimulus values and are denoted X, Y and Z, respectively. The most commonly used notations are the CIE XYZ colour space devised in 1931 by the International Commission on Illumination. The system is based on the trichromatic principle, but instead of using real red, green and blue primaries with their necessity for negative matching, it uses imaginary positive primaries, X, Y and Z. It uses the chromaticity diagram to designate various colours. Primary Y, known as luminous reflectance or transmittance, contains the entire lightness stimulus. The application of the weighting to a reflectance curve gives the tristimulus values, which are denoted by the capital letters X, Y and Z. These values are then used to calculate the chromaticity coordinates, designated by lowercase letters x (red), y (green) and z (blue). The value for x can be calculated as x0X/(X+Y+Z). The values for y and z can be calculated by replacing X with Y and Z, respectively, in the numerator
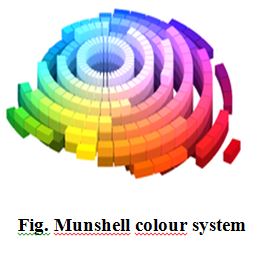
Munshell colour system:
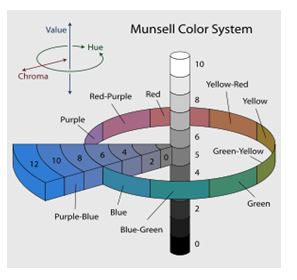
In colorimetry, the Munsell color system is a color space that specifies colors based on three color dimensions: hue, value (lightness), and chroma (color purity). It was created by Professor Albert H. Munsell in the first decade of the 20th century and adopted by the USDA as the official color system for soil research in the 1930s. The system consists of three independent dimensions which can be represented cylindrically in three dimensions as an irregular color solid: hue, measured by degrees around horizontal circles; chroma, measured radially outward from the neutral (gray) vertical axis; and value, measured vertically from 0 (black) to 10 (white).
Munshell Hue:
Each horizontal circle is divided into five principal hues: Red, Yellow, Green, Blue, and Purple, along with 5 intermediate hues halfway between adjacent principal hues. Each of these 10 steps, with the named hue given number 5, is then broken into 10 sub-steps, so that 100 hues are given integer values. In practice, color charts conventionally specify 40 hues, in increments of 2.5, progressing as for example 10R to 2.5YR. Two colors of equal value and chroma, on opposite sides of a hue circle, are complementary colors, and mix additively to the neutral gray of the same value.
Munshell Value:
Value, or lightness, varies vertically along the color solid, from black (value 0) at the bottom, to white (value 10) at the top. Neutral grays lie along the vertical axis between black and white.
Munshell Chroma:
Chroma, measured radially from the center of each slice, represents the “purity” of a color, with lower chroma being less pure. Different areas of the color space have different maximal chroma coordinates. For instance light yellow colors have considerably more potential chroma than light purples, due to the nature of the eye and the physics of color stimuli. This led to a wide range of possible chroma levels—up to the high 30s for some hue–value combinations.
Hunter Lab colour value:
 The Hunter L a b developed in 1948 for photoelectric measurement and the CIE L*a*b* colour space devised in 1976 provide more uniform colour differences in relation to human perception of differences.
An object, a light source or an illuminant, and an observer are required for the presence of colour. A light source can be turned on and off and can be used to view an object. However, an illuminant is a mathematical description of a light source. In 1931, the CIE recommended three standard illuminants. Illuminant A defines light typical of that from an incandescent lamp, illuminant B represents direct sunlight, and illuminant C represents average daylight from the total sky. In 1966, the CIE proposed a fourth series, the D illuminants. These illuminants represent daylight more completely and accurately than illuminants B and C. The D illuminants are usually identified by the first two digits of their colour temperature. In 1986, the CIE recommended the use of an E series of illuminants for fluorescent lamps.
CIE colorimetry:
Lovibond tintometer:
In the 1860s, Joseph Lovibond, the founder of The Tintometer Ltd, developed the original Lovibond Color system, which was based on a calibrated series of red, yellow and blue glass color standards. Used for analysis of products such as edible and industrial oils, fuel oils, chemicals, coatings and beverages.
Quantification of Colour:
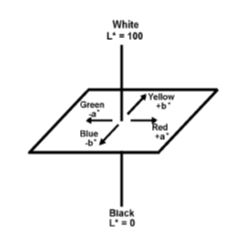
The HunterLab L*,a*,b* and the modified CIE system called CIELAB colour scales were opponent-type systems commonly used in the food industry. The CIELAB coordinates (L*, a*, b*) were directly read. It was considered the CIELAB uniform space in which two colour coordinates, a* and b*, as well as a psychometric index of lightness, L*, were measured. The parameter a* takes positive values for reddish colours and negative values for the greenish ones, whereas b* takes positive values for yellowish colours and negative values for the bluish ones. L* is an approximate measurement of luminosity, which is the property according to which each colour can be considered as equivalent to a member of the greyscale, between black and white.
Chroma: Chroma (C*), considered the quantitative attribute of colourfulness, is used to determine the degree of difference of a hue in comparison to a grey colour with the same lightness. The higher the chroma values, the higher is the olour intensity of samples perceived by humans.


Hue angle: Hue angle (h*), considered the qualitative attribute of colour, is the attribute according to which colours have been traditionally defined as reddish, greenish, etc., and it is used to define the difference of a certain colour with reference to grey colour with the same lightness. This attribute is related to the differences in absorbance at different wavelengths. A higher hue angle represents a lesser yellow character in the assays. An angle of 0° or 360° represents red hue, whilst angles of 90°, 180° and 270° represent yellow, green and blue hues, respectively. It has been extensively used in the evaluation of colour parameters in green vegetables, fruits and meats.

Derived General Objective Colour Indices
Total Colour Difference
Colour changes can be measured as the modulus of the distance vector between the initial colour values and the actual colour coordinates. This concept is named total colour difference. Total colour difference indicates the magnitude of colour difference between stored/ processed and control samples. Total colour difference (ΔE) indicates the colour difference from the standard plate.

Whiteness index:
Whiteness indices (WI) are widely measured to yield numbers correlating closely with consumers’ preferences for white colours. It mathematically combines lightness and yellow–blue into a single term. The WI represents the overall whiteness of food products that may indicate the extent of discoloration during the processing.

Yellowness Index
Yellowness is associated with scorching, soiling, and general product degradation by light, chemical exposure and processing. Yellowness indices are used chiefly to quantify these types of degradation with a single value. They can be used when measuring clear, near-colourless liquids or solids in transmission and near-white, opaque solids in reflectance. Yellowness index (YI) indicates the degree of yellowness.

Browning Index:
Browning colouration is an important phenomenon in food handling and processing, including baking, drying and frying, because it affects appearance quality. Therefore, the measurement and quantification of browning is important in food research and industrial practice during sorting and grading to meet market requirements. It results from both enzymatic and non-enzymatic oxidation of phenolic compounds. The browning index (BI) is used to characterise the overall changes in browning colour. It is defined as brown colour purity and is one of the most common indicators of browning in food products containing sugar.

Conversion of Hunter Values to CIE values

References:
Pankaj B. Pathare & Umezuruike Linus Opara & Fahad Al-Julanda Al-Said
Colour Measurement and Analysis in Fresh and Processed Foods: A Review. Food Bioprocess Technol (2013) 6:36–60 DOI 10.1007/s11947-012-0867-9
Last modified: Friday, 30 August 2013, 6:47 AM