Site pages
Current course
Participants
General
Module 1. Average and effective value of sinusoida...
Module 2. Independent and dependent sources, loop ...
Module 3. Node voltage and node equations (Nodal v...
Module 4. Network theorems Thevenin’ s, Norton’ s,...
Module 5. Reciprocity and Maximum power transfer
Module 6. Star- Delta conversion solution of DC ci...
Module 7. Sinusoidal steady state response of circ...
Module 8. Instantaneous and average power, power f...
Module 9. Concept and analysis of balanced polypha...
Module 10. Laplace transform method of finding ste...
Module 11. Series and parallel resonance
Module 12. Classification of filters
Module 13. Constant-k, m-derived, terminating half...
LESSON 1. Average and effective value of sinusoidal forms
1. Introduction to Alternating Currents and Voltages
1.1 The Sine Wave
Many a time, alternating voltages and currents are represented by a sinusoidal wave, or simply a sinusoid. It is a very common type of alternating current (ac) and alternating voltage. The sinusoidal wave is generally referred to as a sine wave. Basically an alternating voltage (current) waveform is defined as the voltage (current) that fluctuates with time periodically, with change in polarity and direction. In general, the sine wave is more useful than other waveforms, like pulse, saw tooth, square, etc. There are a number of reasons for this. One of the reasons is that if we take any second order system, the response of this system is a sinusoid. Secondly, any periodic waveform can be written in terms of sinusoidal function according to Fourier there. Another reason is that its derivatives and integrals are also sinusoids. A sinusoidal function is easy to analyze. Lastly, sinusoidal function is easy to generate, and it is more useful in the power industry. The shape of a sinusoidal waveform is shown in Fig.1.1.
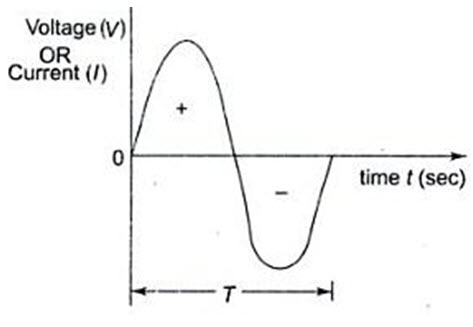
The waveform may be either a current waveform, or a voltage waveform. As seen from the Fig. 1.1, the wave changes its magnitude and direction with time. If we start at time t = 0, the wave goes to a maximum value and returns to zero, and the 4n decreases to a negative maximum value before returning to zero. The sine wave changes with time in an orderly manner. During the positive portion of voltage, the current flows in one direction; and during the negative portion of voltage, the current flows in the opposite direction. The complete positive and negative portion of the wave is one cycle of the sine wave. Time is designated by t. The time taken for any wave to complete one full cycle is called the period (T). In general, any periodic wave constitutes a number of such cycles. For example, one cycle of a sine wave repeats a number of times as shown in Fig.1.2. Mathematically it can be represented as f((t) = f(t + T) for any t.
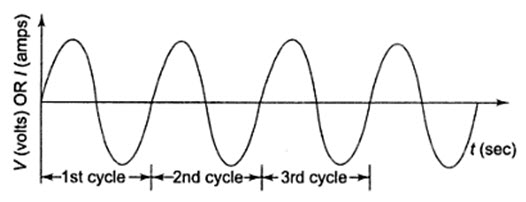
Fig.1.2
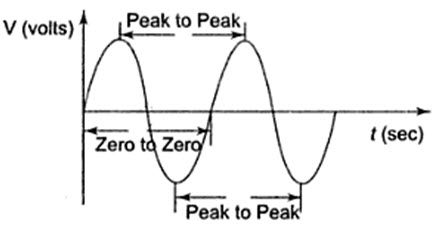
The period can be measured in the following different ways (See Fig.1.3).
From zero crossing of one cycle to zero crossing of the next cycle.
From positive peak of one cycle to positive peak of the next cycle, and
From negative peak of one cycle to negative peak of the next cycle.
Fig.1.3
The frequency of a wave is defined as the number of cycles that a wave completes in one second.
In Fig.1.4 the sine wave completes three cycle in one second. Frequency is measured in hertz. One hertz is equivalent to one cycle per second, 60 hertz is 60 cycles per second and so on. In Fig.1.4, the frequency denoted by f is 3 Hz, that is three cycles per second. The relation between time period and frequency is given by
\[f={1 \over T}\]
A sine wave with a longer period consists of fewer cycles than one with a shorter period.
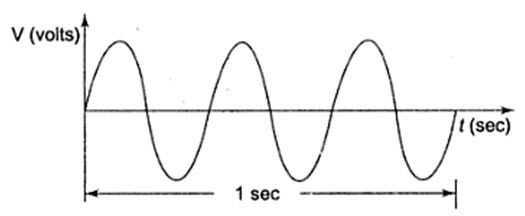
Fig.1.4
1.2. Angular Relation of a Sine Wave
A sine wave can be measured along the X-axis on a time base which is frequency-dependent. A sine wave can also be expressed in terms of an angular measurement. This angular measurement is expressed in degrees or radians. A radian is defined as the angular distance measured along the circumference of a circle which is equal to the radius of the circle. One radian is equal to 57.30. In a 3600 revolution, there are 2 \[\pi\] radians. The angular measurement of a sine wave is based on 3600 or 2\[\pi\] radians for a complete cycle as shown in Figs.1.5 (a) and (b).
A sine wave completes a half cycle in 1800 or \[\pi\] radian, a quarter cycle in 900 or \[\pi\]/2 radians, and so on.

Fig.1.5
Phase of a Sine Wave
The phase of a sine wave is an angular measurement that specifies the position of the sine wave relative to a reference. The wave shown in Fig.1.6 is taken as the reference wave. When the sine wave is shifted left or right with reference to the wave shown in Fig.1.6, there occurs a phase shift. Figure 4.8 shows the phase shifts of a sine wave.
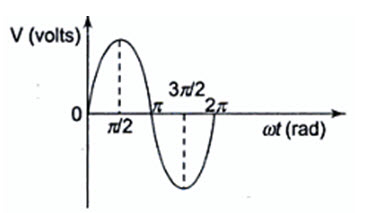
Fig.1.6
In Fig.1.7 (a), the sine wave is shifted to the right by 900 (\[\pi\]/2 rad) shown by the dotted lines. There is a phase angle of 900 between A and B. Here the waveform B is lagging behind waveform A by 900. In other words, the sine wave A is leading the waveform B by 900. In Fig.1.7 (b) the sine wave A is lagging behind the waveform B by 900. In both cases, the phase difference is 900.
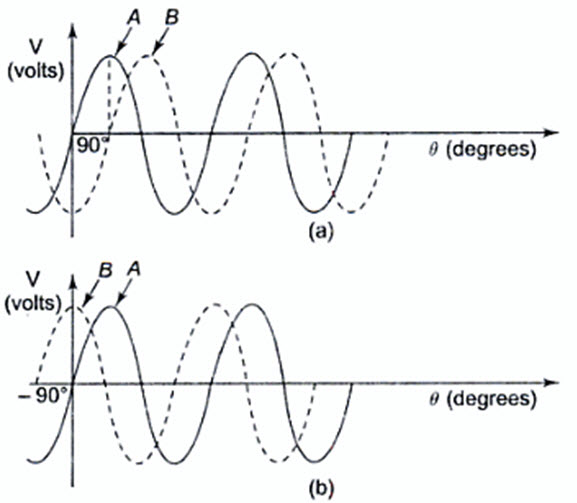
Fig. 1.7
1.3. The sine Wave Equation
A sine wave is graphically represented as shown in Fig. 1.8 (a). The amplitude of a sine wave is represented on vertical axis. The angular measurement (in degrees or radians) is represented on horizontal axis. Amplitude A is the maximum value of the voltage or current on the Y-axis.
In general, the sine wave is represented by the equation
V(t) = Vm sin wt
The above equation states that any point on the sine wave represented by instantaneous value v(t) is equal to the maximum value times the sine of the angular frequency at the point. For example, if a certain sine wave voltage has peak value of 20 V, the instantaneous voltage at a point π/4 radius along the horizontal axis can be calculated has
V(t) = Vm sin wt
\[=20\,\sin \left( {{\pi\over 4}} \right)=20 \times 0.707=14.14V\]
When a sine wave is shifted to the left of the reference wave by a certain angle ø, as shown in Fig.1.8 (b), the general expression can be written as
v(t) = Vm sin (wt + ø)
When a sine wave is shifted to the right of the reference wave by a certain angle ø, as shown in Fig.1.8 (c), the general expression can be written as
v(t) = Vm sin (wt - ø)
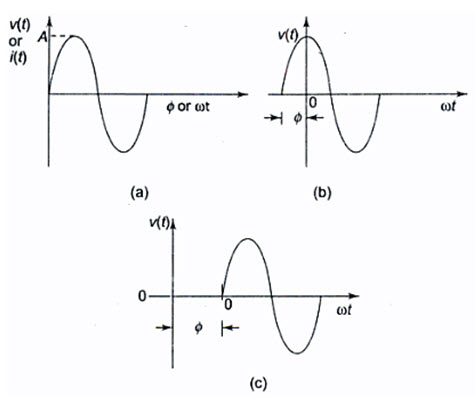
Fig.1.8
Last modified: Wednesday, 25 September 2013, 6:35 AM