Site pages
Current course
Participants
General
Module 1. Average and effective value of sinusoida...
Module 2. Independent and dependent sources, loop ...
Module 3. Node voltage and node equations (Nodal v...
Module 4. Network theorems Thevenin’ s, Norton’ s,...
Module 5. Reciprocity and Maximum power transfer
Module 6. Star- Delta conversion solution of DC ci...
Module 7. Sinusoidal steady state response of circ...
Module 8. Instantaneous and average power, power f...
Module 9. Concept and analysis of balanced polypha...
Module 10. Laplace transform method of finding ste...
Module 11. Series and parallel resonance
Module 12. Classification of filters
Module 13. Constant-k, m-derived, terminating half...
LESSON 2. Linear periodic wave forms
2.1 Voltage and Current Values of A sine Wave
As the magnitude of the waveform is not constant, the waveform can be measured in different ways. These are instantaneous, peak, peak to peak, root mean square (rms) and average values.
Instantaneous value
Consider the sine wave shown in Fig.2.1. At any given time, it has some instantaneous value. This value is different at different points along the waveform.
In fig. 2.1 during the positive cycle, the instantaneous values are positive and during the negative cycle, the instantaneous values are negative. In Fig.2.1 shown at time 1 ms, the value is 4.2 V; the value is 10 V at 2.5 ms, - 2V at 6 ms and -10 V at 7.5 and so on.
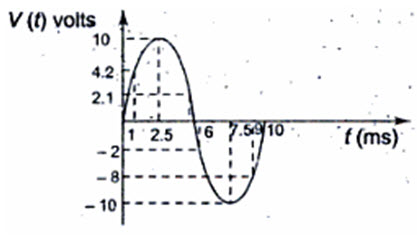 Fig.2.1
Peak value
The peak value of the sine wave is the maximum value of the wave during positive half cycle, or maximum value of wave during negative half cycle. Since the value of these two is equal in magnitude, a sine wave is characterized by a single peak value. The peak value of the sine wave is shown in Fig.2.2; here the peak value of the sine wave is 4 V.
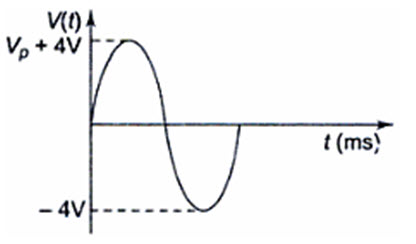
Fig. 2.2
Peak to Peak Value
The peak to peak value of a sine wave is the value from the positive to the negative peak as shown in Fig.2.3. Here the peak to peak value is 8V.
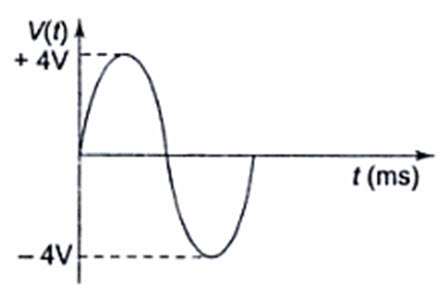
Fig. 2.3
Average Value
In general, the average value of any function v(t), with period T is given by
\[{v_{av}}={1 \over T}\int\limits_0^T {v\left( t \right)} dt\]
That means that the average value of a curve in the X-Y plane is the total area under the complete curve divided by the distance of the curve. The average value of a sine wave over one complete cycle is always zero. So the average value of a sine wave is defined over a half-cycle, and not a full cycle period. The average value of the sine wave is the total area under the half-cycle curve divided by the distance of the curve.
v(t) = Vp sin wt is given by
\[{v_{av}}={1\over\pi}\int\limits_0^\pi{{V_P}Sin\,\,\omega t\,\,d(\omega t)}\]
\[={1 \over \pi }\left[ { - {V_P}Cos\omega t} \right]_0^\pi\]
\[={{2{V_P}} \over \pi }=\,\,0.637\,{V_P}\]
The average value of a sine wave is shown by the dotted line in Fig.2.4
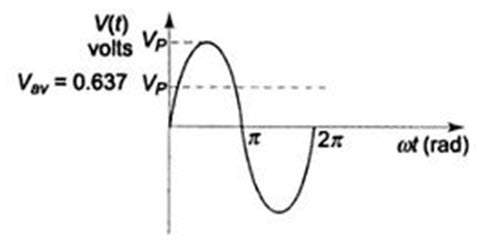
Fig.2.4
Root Mean Square Value or Effective Value
The root mean square (rms) value of a sine wave is a measure of the heating effect of the wave. When a resistor is connected across a dc voltage source as shown in Fig. 2.5 (a), a certain amount of heat is produced in the resistor in a given time. A similar resistor is connected across an ac voltage source for the same time as shown in Fig. 2.5 (b). The value of the ac voltage is adjusted such that the same amount of heat is produced in the resistor as in the case of the dc source. The value is called the rms value.

Fig.2.5
That means the rms value of a sine wave is equal to the dc voltage that produces the same heating effect. In general, the rms value of any function with period T has an effective value given by
\[{V_{rms}}=\sqrt {{1 \over T}\int\limits_0^T {{v\left( {t)} \right)}\limits^{ - - 2} dt} }\]
Consider a function v(t) = Vp Sin wt
The rms value, \[{V_{rms}}=\sqrt {{1 \over T}\int\limits_0^T {{{\left( {{V_p}\,\sin \,\omega t} \right)}^2}\,\,d\left( {\omega t} \right)} }\]
\[=\,\sqrt {{1 \over T}\int\limits_0^{2\pi} {V_p^2\,\left[ {{{1 - \cos \,2\omega t} \over 2}} \right]d\,\left( {\omega t} \right)} }\]
\[=\,{{{V_p}} \over {\sqrt 2 }}=0.707\,\,{V_p}\]
If the function consists of a number of sinusoidal terms, that is
\[v(t)\,={V_0} + \left( {{V_{c1}}\cos \,\,\omega t + {V_{c2}}\,\,\cos \,2\,\,\omega t + .....} \right) + \left( {{V_{s1}}\,\sin \,\omega t + {V_{s2}}\,\,\sin \,2\,\omega t + .......} \right)\]
\[Vrms=\sqrt {V_0^2 + {1 \over 2}\left( {V_{c1}^2 + V_{c2}^2 + ...} \right) + {1 \over 2}\left( {V_{s1}^2 + V_{s2}^2 + .....} \right)}\]
Peak Factor
The peak factor of any waveform is defined as the ratio of the peak value of the wave to the rms value of the wave.
Peak factor \[={{{V_p}} \over {{V_{rms}}}}\]
Peak factor of the sinusoidal waveform \[={{{V_p}} \over {{V_p}/\sqrt 2 }}=\sqrt 2=1.414\]
Form Factor
Form factor of a waveform is defined as the ratio of rms value to the average value of the wave.
Form factor \[={{{V_{rms}}} \over {{V_{av}}}}\]
Form factor of a sinusoidal waveform can be found from the above relation.
For the sinusoidal wave, the form factor \[={{Vp/\sqrt 2 } \over {0.637\,{V_p}}}=1.11\]
2.2. Phase Relation in a Pure Resistor
When a sinusoidal voltage of certain magnitude is applied to a resistor, a certain amount of sine wave current passes through it. We known the relation between v(t) and i(t) in the case of a resistor. The voltage / current relation in case of a resistor is linear,
i.e. v(t) = i(t) R
Consider the function
\[i\left( t \right)={I_m}\sin \,\omega t=IM\left[ {{I_m}{e^{j\omega t}}} \right]\,or\,{I_m}\angle {0^0}\]
If we substation this in the above equation, we have
v(t)=ImR sin wt = Vm sin wt
\[IM\left[ {{V_m}{e^{j\omega t}}} \right]\,or\,{V_m}\angle {0^0}\]
where Vm = Im R
If we draw the waveform for both voltage and current as shown in Fig.2.6. there is no phase difference between these two waveforms. The amplitudes of the waveform may differ according to the value of resistance.
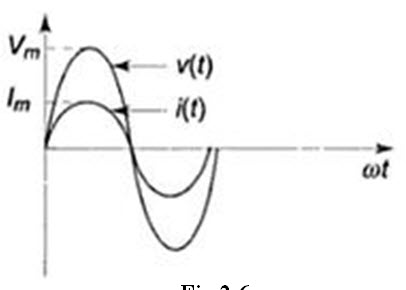
As a result, in pure resistive circuits, the voltages and currents are said to be in phase. Here the term impedance is defined as the ratio of voltage to current function. With ac voltage applied to elements, the ratio of exponential voltage to the corresponding current (impedance) consists of magnitude and phase angles. Since the phase difference is zero in case of a resistor, the phase angle is zero. The impedance in case of resistor consists only of magnitude, i.e.
\[Z={{{V_m}\angle {0^0}} \over {{I_m}\angle {0_0}}}=R\]
2.3. Phase Relation in a Pure Inductor
The voltage current relation in the case of an inductor is given by
\[v\left( t \right)=L{{di} \over {dt}}\]
Consider the function \[i\left( t \right)={I_m}\sin \,\omega t=IM\left[ {{I_m}{e^{j\omega t}}} \right]\,or\,{I_m}\angle {0^0}\]
\[v\left( t \right)=L{d \over {dt}}\left( {{I_m}\sin \,\omega t} \right)\]
\[=L\omega {I_m}\,\cos \,\omega t\,{I_m}\,\cos \,\omega t\]
\[v\left( t \right)={V_m}\cos \,\omega t,\,\,or\,\,{V_m}\,\sin \left( {\omega t + {{90}^0}} \right)\]
\[=IM\left[ {{V_m}{e^{j\left( {\omega t + {{90}^0}} \right)}}} \right]\,\,or\,\,{V_m}\angle {90^0}\]
Where \[{V_m}=\omega L{I_m}={X_L}{I_m}\]
and \[{e^{j{{90}^0}}}=j=1\angle {90^0}\]
If we draw the waveforms for both, voltage and current, as shown in Fig.2.7, we can observe the phase difference between these two waveforms.
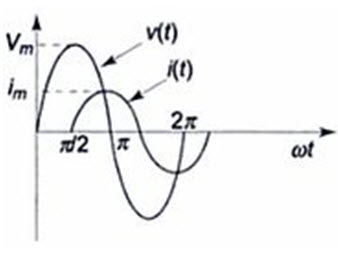
Fig.2.7
As a result, in a pure inductor the voltage and current are out of phase. The current lags behind the voltage by 900 in a pure inductor as shown in Fig.2.8.
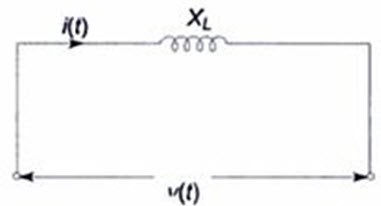
Fig.2.8
The impedance which is the ratio of exponential voltage to the corresponding current, is given by
\[Z={{{V_m}\sin \left( {\omega t + {{90}^0}} \right)} \over {{I_m}\sin \omega t}}\]
where \[{V_m}=\omega L{I_m}\]
\[={{{I_m}\omega L\sin \left( {\omega t + {{90}^0}} \right)} \over {{I_m}\sin \omega t}}\]
\[={{\omega L\,{I_m}\angle {{90}^0}} \over {{I_m}\angle {0^0}}}\]
\[Z=j\omega L=j{X_L}\]
where XL = wL and is called the inductive reactance.
Hence, a pure inductor has impedance whose value is wL,
2.4. Phase Relation in a Pure Capacitor
The relation between voltage and current is given by
\[v\left( t \right)={1 \over C}\int {i\left( t \right)} dt\]
Consider the function \[i\left( t \right)={I_m}\sin \,\omega t = IM\left[ {{I_m}{e^{j\omega t}}} \right]\,or\,{I_m}\angle {0^0}\]
\[v\left( t \right)={1 \over C}\int {{I_m}\;\sin \,\omega t\,d\left( t \right)}\]
\[={1 \over {\omega C}}{I_m}\left[ { - \cos \,\omega t} \right]\]
\[={{{I_m}} \over {\omega C}}\sin \,\left( {\omega t - {{90}^0}} \right)\]
\[v\left( t \right)={V_m}\,\sin \,\left( {\omega t - {{90}^0}} \right)\]
\[=IM\left[ {{\mathop{\rm Im}\nolimits} {e^{j\left( {\omega t - {{90}^0}} \right)}}} \right]\,\,or\,\,{V_m}\angle-{90^0}\]
where \[{V_m}={{{I_m}} \over {\omega C}}\]
\[={{{V_m}\angle-{{90}^0}} \over{{I_m}\angle {0^0}}}=Z={{ - j}\over{\omega C}}\]
Hence, the impedance is \[Z={{-j}\over{\omega C}}=-j{X_C}\]
where \[{X_C}={1\over{\omega C}}\] and is called the capacitive reactance.
If we draw the waveform for both, voltage and current, as shown in Fig.2.9, there is a phase difference between these two waveforms.
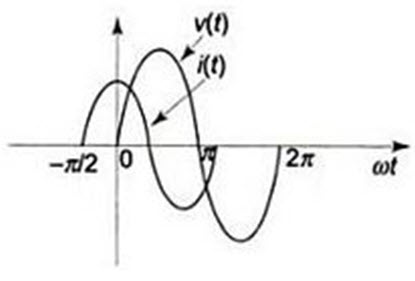
Fig.2.9
As a result, in a pure capacitor, the current leads the voltage by 900. The impedance value of a pure capacitor.
\[{X_C}={1 \over {\omega C}}\]