Site pages
Current course
Participants
General
Module 1. Management Concepts & Principle
Module 2. Management Functions
Module 3. Marketing Management
Module 4. Concepts and application of management p...
Module 5. Production, Consumption, Processing and ...
Module 6. Meaning & Theories of International ...
Module 7. WTO provisions for trade in agricultural...
12 April - 18 April
19 April - 25 April
26 April - 2 May
Lesson-25 Consumption of Agricultural Products
25.1 INTRODUCTION
Study of food consumption pattern or expenditure pattern is very important as it is related to poverty and standard of living of our society. It is necessary to study the changes in food consumption pattern under the changing situations of liberalization, privatization and globalization. The analysis of changing food consumption pattern over time would help in designing appropriate policies related to food production and distribution. Food expenditure pattern is an excellent indicator of economic well being of people. If the society is wealthy proportionately high expenditure will be made on secondary necessities, comfort, luxury products and conspicuous consumption. On the other, if the society is at subsistence level, people will spend proportionately more on food. This lesson explains how the consumption pattern has changed over the period.
25.2 FACTORS INFLUENCING CONSUMPTION PATTERN
A number of factors can influence household consumption patterns. These can be economic (e.g., income and price changes), social (e.g., urbanisation leading to dietary changes), cultural (e.g., influences by exotic lifestyles), and market development that makes new foods available. Among these factors, however, income is seen to be the most influential. There are a number of studies that show that the level of income affects not only the level but also the composition of food consumption. The increase in consumer income in fast-growing developing countries tends to induce greater changes in the composition of food consumption.
25.3 CONSUMPTION PATTERN: From cereals to High Value Products
The National Sample Survey (NSS) data are used in our analysis. The NSS data are collected by the National Sample Survey Organisation (NSSO) under the Ministry of Planning from a large sample of households through various annual rounds. The data have a high reputation and acceptance in research and policy. Not all annual rounds extensively cover household consumption behaviour; instead, a comprehensive data collection takes place about every 5 or 6 years. In this study, we use information from NSS surveys conducted in 1970-71, 1977-78, 1983, 1987-88, 1993/94, 1999/00 and 2004/05. These are national surveys with sample sizes of over 100,000 households (both rural and urban). The rural and urban samples are distinct and their results are reported separately. NSSO publishes summary results soon after each survey. More detailed survey reports are generally published a few years later.
Presented in Table 25.1 are changes in total consumption expenditures over the period 1970/71 to 2004/05. They are averages over all income classes. In rural areas, foods dominate the consumption expenditure. Within foods, cereals dominate. Nonetheless, the percentage of expenditure on foods has dropped from 73.6% in 1970/71 to 55.0% in 2004/05. The percentage of expenditure on cereals within food has dropped from a dominant 54.4% to 32.7% during the same time period. After cereals, livestock products clearly are the next important food group, with an expenditure share reaching 21.4% in 2004/05, being the second largest. Table 1 show that the share of vegetables increased two folds in 2004/5 compared to the period 1970/71. It is noted, however, the growth in expenditure share on edible oils and vegetables and fruits was quite impressive between 1970/71 and 2004/05. In urban areas, the share of expenditure on food has also dropped but still remains substantial at 42.5%. However, the importance (share) of livestock products has increased to 25% by 2004/05, surpassing the share of cereals which has fallen to 23.7%. The cross-over is recent and took place between the last two surveys. Other foods such as pulses, edible oils, and vegetables and fruits lag substantially behind livestock products. Thus it can be understood that there is a clear shift in the consumption pattern from cereals to high value products like, livestock products and vegetables.
The results show that, in both rural and urban areas, livestock products have risen substantially in importance. It is noted that, food expenditure in India by 2004/05 still accounted for a significant share of total consumption expenditure, being 50% on an all-India basis, with rural being 55% and urban 42.5%.
Table 25.1. Consumption Expenditure: Rs. Average Per Capita per Month
|
Item |
Value (Rs) |
Share % |
|||||||
|
1970/1 |
1977/8 |
1983 |
1987/8 |
1993/4 |
1999/00 |
2004/5 |
1970/1 |
2004/5 |
|
|
Rural |
|
|
|
|
|
|
|
|
|
|
Cereals |
14.14 |
22.82 |
36.52 |
41.54 |
68.13 |
107.75 |
100.65 |
54.4 |
32.7 |
|
Pulses |
1.56 |
2.92 |
4.25 |
6.65 |
10.72 |
18.5 |
17.18 |
6 |
5.6 |
|
Livestock Products |
4.03 |
7.13 |
11.85 |
18.74 |
36.09 |
58.7 |
65.91 |
15.5 |
21.4 |
|
Edible oils |
1.26 |
2.46 |
4.53 |
8.88 |
12.43 |
18.16 |
25.72 |
4.8 |
8.4 |
|
Vegetables |
1.7 |
3.37 |
6.86 |
10.8 |
21.9 |
38.34 |
44.49 |
6.5 |
14.5 |
|
Other Food Items |
3.27 |
5.63 |
9.71 |
15.21 |
28.5 |
47.35 |
53.65 |
12.6 |
17.4 |
|
Food Total |
25.98 |
44.33 |
73.73 |
100.82 |
177.77 |
288.8 |
307.6 |
73.6 |
55 |
|
Non-food Total |
9.33 |
24.56 |
38.71 |
57.28 |
103.63 |
197.36 |
251.18 |
26.4 |
45 |
|
Total Cons. Expenditure |
35.31 |
68.89 |
112.45 |
158.1 |
281.4 |
486.16 |
558.78 |
100 |
100 |
|
No. of sample hhs |
87593 |
99766 |
75911 |
83039 |
69206 |
71385 |
79296 |
|
|
|
Urban |
|
|
|
|
|
|
|
|
|
|
Cereals |
12.12 |
19.76 |
31.98 |
37.14 |
64.27 |
105.57 |
105.82 |
35.6 |
23.7 |
|
Pulses |
1.76 |
3.67 |
5.6 |
8.85 |
13.92 |
24.25 |
22.51 |
5.2 |
5 |
|
Livestock Products |
6.91 |
12.49 |
21.07 |
32.68 |
60.39 |
100.95 |
111.77 |
20.3 |
25 |
|
Edible oils |
2.41 |
4.46 |
7.94 |
13.23 |
20.09 |
26.81 |
36.37 |
7.1 |
8.1 |
|
Vegetables |
3.35 |
6.11 |
11.63 |
19.39 |
37.17 |
64.58 |
70.49 |
9.8 |
15.8 |
|
Other Food Items |
7.49 |
11.18 |
18.75 |
28.46 |
54.48 |
88.68 |
100.45 |
22 |
22.5 |
|
Food Total |
34.04 |
57.67 |
96.97 |
139.75 |
250.32 |
410.84 |
447.41 |
64.4 |
42.5 |
|
Non-food Total |
18.81 |
38.48 |
67.06 |
110.18 |
207.72 |
444.08 |
604.95 |
35.6 |
57.5 |
|
Total Cons. Expenditure |
52.85 |
96.15 |
164.03 |
249.93 |
458.04 |
854.92 |
1052.36 |
100 |
100 |
|
No. of sample hhs |
18930 |
58162 |
41983 |
45989 |
46148 |
48924 |
45346 |
|
|
Table 25.2 provides further details about the levels and composition of food demand and livestock product demand in India. It is based on the latest data from NSS (2007) for 2004/05. All-India results are a weighted average using population as the weight. The results indicate substantial diversity in consumption quantities and values. The total consumption expenditure at Rs 1052 per month in urban areas is almost twice that in rural areas at Rs 559 per month. However, the total food expenditure does not differ by that much, with a difference being Rs 140. It is important to note that the consumption difference in livestock products explains the largest portion of the total food consumption difference. This suggests that there is an enormous potential for an increase in livestock product consumption if rural income was higher given the huge rural population in India.
Table 25.2. Per Capita Consumption: Quantity and Value Per Month, 2004/05
|
Item |
Rural |
Urban |
All India |
|||
|
Quantity (Kg) |
Value (Rs) |
Quantity (Kg) |
Value (Rs) |
Quantity (Kg) |
Value (Rs) |
|
|
Rice |
6.38 |
58.93 |
4.71 |
56.14 |
5.95 |
58.22 |
|
Wheat |
4.19 |
29.83 |
4.36 |
38.86 |
4.23 |
32.12 |
|
Cereals |
12.11 |
100.65 |
9.94 |
105.82 |
11.56 |
101.96 |
|
Pulses |
0.71 |
17.91 |
0.82 |
23.62 |
0.74 |
19.36 |
|
Livestock Products |
|
65.91 |
- |
111.77 |
- |
77.52 |
|
Edible Oils |
0.48 |
25.72 |
0.66 |
36.37 |
0.53 |
28.42 |
|
Vegetables |
|
36.23 |
- |
49.91 |
- |
39.69 |
|
Fruits |
|
10.42 |
- |
23.65 |
- |
13.77 |
|
Sugar |
0.74 |
13.25 |
0.87 |
15.88 |
0.77 |
13.92 |
|
Spices (gm) |
75.92 |
10.62 |
189.76 |
13.13 |
104.74 |
11.26 |
|
Beverages & Others |
- |
25.37 |
- |
65.31 |
- |
35.48 |
|
Total Food |
|
307.60 |
- |
447.41 |
- |
342.99 |
|
Total Non-food |
|
251.18 |
- |
604.95 |
- |
340.74 |
|
Total |
- |
558.78 |
- |
1052.36 |
- |
683.73 |
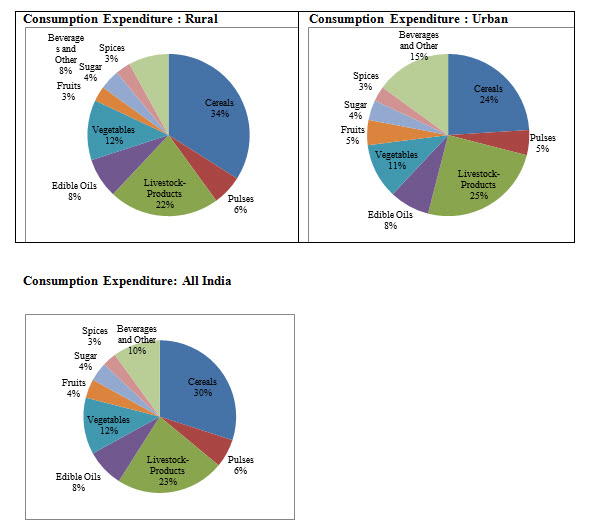
Figure 25.1 shows the distribution of food expenditure across different food commodity groups. In rural areas, cereals constitute a larger share of food expenditure at 34%. This is followed by livestock products and vegetables which constitute 22% & 12% of the food expenditure respectively. In urban areas, the share of the livestock products at 25% is the highest in foods, followed by cereals and vegetables with 21% & 11% of the food expenditure respectively. Thus, although cereals still dominate at the national level, high value product like livestock product has surpassed cereals in importance in urban areas. However, there is a clear trend of shift towards high value products at all India level.
Figure 25.1. Share of consumer food expenditure: Rural, Urban, and All India, 2004/05
Last modified: Friday, 7 February 2014, 9:33 AM