Site pages
Current course
Participants
General
Module 1:Water Resources Utilization& Irrigati...
Module 2:Measurement of Irrigation Water
Module 3: Irrigation Water Conveyance Systems
Module 4: Land Grading Survey and Design
Module 5: Soil –Water – Atmosphere Plants Intera...
Module 6: Surface Irrigation Methods
Module 7: Pressurized Irrigation
Module 8: Economic Evaluation of Irrigation Projec...
19 April - 25 April
26 April - 2 May
LESSON 25 Evapotranspiration
25.1 Evaporation and Transpiration
Evapotranspiration is one of the major components of the hydrologic cycle and affects crop water demand. Therefore, its quantification is necessary for proper irrigation planning. The term evapotranspiration refers to combination of two processes, namely, evaporation and transpiration (Fig. 25.1). Evaporation is a process by which water is lost in the form of vapour from natural surfaces, such as freewater surface, bare soil, from live or dead vegetation. Transpiration is a process by which water is lost in the form of vapour through plant leaves. Therefore evapotranspiration is a combined loss of water from the soil (evaporation)and plant (transpiration) surfaces to the atmosphere through vaporization of liquid water, and is expressed in depth per unit time (for example mm/day).
Consumptive use (CU) – CU is used to designate the losses due to ET and water that is used for its metabolic activities of plants thus CU exceed ET by the amount of water used for digestion, photosynthesis, transport of minerals and photosynthates, structural support and growth. Since this difference is usually less than 1%, ET and CU are normally assumed to be equal. But both (CU &ET) terms are used simultaneously.
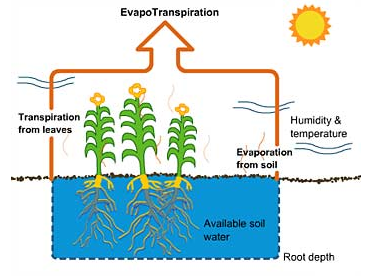
Fig.25.1.Evapotranspiration process.
(Source:http://toolboxes.flexiblelearning.net.au/demosites/series6/605/html/resources/visitor_centre/fact_sheets/text_evap_trans.htm: accessed on June 3, 2013)
ET can be either directly measured for a given crop, soil and climatic conditions or computed using the reference crop ET, which is generally estimated by various methods depending upon availability of data for a particular case.
25.2 Concept of Reference Crop Evapotranspiration
Reference Crop ET – is the potential ET for a specific crop (usually either grass or alfalfa) and set of surrounding (advective) conditions. According to Doorenbos and Pruitt (1977) ”ET from an extensive surface of 8 10 15 cm tall, green grass covers of uniform height, actively growing, completely shading the ground and not short of water”. Allen et al. (1998) modified the above definition to represent hypothetical grass surface. Reference crop evapotranspiration from an extensive surface of green grass of uniform height(0.12m), actively growing, completely shading the ground with an albedo of 0.23 and having ample water supply is called reference crop evapotranspiration and is denoted by ETo (Fig. 25.2).
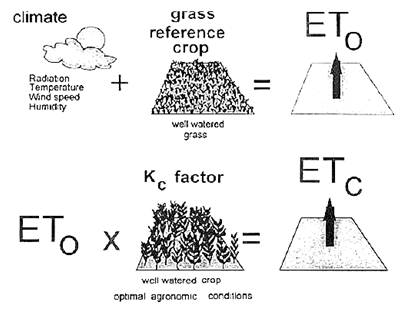
Fig. 25.2.Estimation of reference crop evapotranspiration.
(Source: http://moreprofitperdrop.files.wordpress.com : accessed on June 3, 2013)
Climatic parameters are the only factors affecting ETo and it can be computed from weather data. ET for specific crop can be estimated using reference crop ET and crop coefficients. Typical ranges for ETo values for different agro-climatic regions are given in Table 25.1.
Table 25.1. Average ETo for different agro-climatic regions in mm/day
|
Regions |
Mean daily temperature (°C) |
|||
|
Cool (~10°C) |
Moderate (20°C) |
Warm (> 30°C) |
||
|
Tropics and subtropics |
||||
|
Humid and Sub-humid |
2 – 3 |
3 - 5 |
5 – 7 |
|
|
Arid and Semi-arid |
2 – 4 |
4 - 6 |
6 – 8 |
|
|
Temperate region |
||||
|
Humid and Sub-humid |
1 – 2 |
2 - 4 |
4 – 7 |
|
|
Arid and Semi-arid |
1 – 3 |
4 - 7 |
6 – 9 |
|
(Source:http://www.angrau.ac.in/media/7380/agro201.pdf: accessed on June 3, 2013)
25.3 ET Estimation Methods
Due to wide application of evapotranspirtaion data, various indirect ET estimation methods have been developed over the years. These methods can be grouped into four major categories. Although there is large number of methods developed in each category, a few examples are given below:
- Temperature based (Thornwaite, SCS BlaineyCriddle, FAO24 BlaneyCriddle, Hargreaves)
- Radiation based (Turc, Preistly Taylor, Jensen-Haise, and FAO 24 Radiation)
- Pan evaporation based ( Pan evaporation, FAO 24 Pan)
- Combination (Penman, Penman Moneith, FAO 56 Penman Monteith)
Data requirement as well as performance of each of these methods varies. In order to help user with ETo estimation, A Decision Support System for ETo estimation is developed at IIT Kharagpur (Bandopadhyaya et al. 2012), which estimates ETo by 22 well established method and ranks them based on their ETo estimation performance.
25.3.1 Hargreaves Methods
Hargreaves method is a temperature based method and it was derived to overcome non availability of solar radiation data at many locations. Hargreaves and Samani (1985) recommended estimating solar radiation from extraterrestrial radiation and proposed the following equation for estimating ETo in mm/day
![]() (25.1)
(25.1)
Where,
TD = difference between mean monthly maximum and minimum temperatures in °C,
RA= extraterrestrial solar radiation in MJ m-2 d-1,
Tmean = mean monthly air temperature in °C.
25.3.2 ThornthwaiteMethod
The relationship is expressed as:
![]() (25.2)
(25.2)
Where,
ETo = Monthly potential evapotranspiration (cm) or reference crop ET (i.e., ETo)
T= Mean monthly temperature (°C)
I = A heat index for a given area which is the sum of 12 monthly index values i
i is derived from mean monthly temperatures using the following formula:
![]() (25.3)
(25.3)
a = an empirically derived exponent which is a function of I
![]() 25.4
25.4
25.3.3 Pan Method
The amount of water evaporating from a pan is determined by measuring change in water level in the pan and correcting from precipitation (assuming that water loss due to wind action, animals, birds etc., has been prevented or is negligible). USBR Class A Pan evporometer is most commonly used for estimation of pan evaporation and is shown in Fig. 25.3. It is relatively inexpensive and simple way of assessing the evaporative capabilities of the atmosphere.
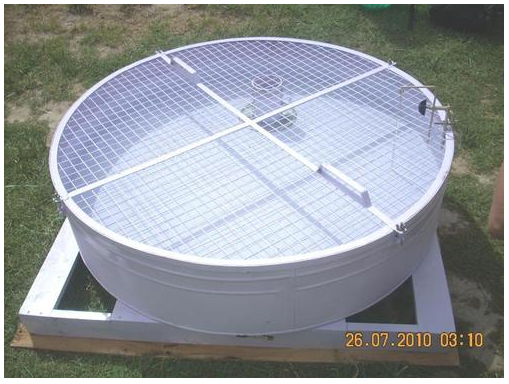
Fig. 25.3. Pan evaporimeter. (Source: http://www.polylabindia.com/open-panevaporimeter-1622575.html, accessed on August 29, 2013)
Reference Crop ET (ETo) is related to Epas follows:
ETo = Ep .kp (25.5)
Where,
ETo = Reference crop ETo in mm/day
Ep = pan evaporation (mm/day)
Kp = pan coefficient
Kp accounts for differences in pan type and conditions upwind of the pan, and for dissimilarities between plants and evaporation pans. Kp values for USBR class a Pan can be chosen from Table 25.2.
Table 25.2.PanCoefficient for USBR Class a pan at varying location of fetch, mean RH and wind run
|
Wind |
Windward side distance of green crop |
RH mean % |
||
|
low |
medium 40-70 |
high > 70 |
||
|
km/day |
m |
< 40 |
||
|
Light |
1 |
0.55 |
0.65 |
0.75 |
|
< 175 |
10 |
0.65 |
0.75 |
0.85 |
|
100 |
0.7 |
0.8 |
0.85 |
|
|
1000 |
0.75 |
0.85 |
0.85 |
|
|
Moderate |
1 |
0.5 |
0.6 |
0.65 |
|
175-425 |
10 |
0.6 |
0.7 |
0.75 |
|
100 |
0.65 |
0.75 |
0.8 |
|
|
1000 |
0.7 |
0.8 |
0.8 |
|
|
Strong |
1 |
0.45 |
0.5 |
0.6 |
|
425-700 |
10 |
0.55 |
0.6 |
0.65 |
|
100 |
0.6 |
0.65 |
0.7 |
|
|
1000 |
0.65 |
0.7 |
0.75 |
|
|
Very strong |
1 |
0.4 |
0.45 |
0.5 |
|
> 700 |
10 |
0.45 |
0.55 |
0.6 |
|
100 |
0.5 |
0.6 |
0.65 |
|
|
1000 |
0.55 |
0.6 |
0.65 |
|
(Source: FAO 24)
25.3.4 FAO-56 Penman – MonteithMethod
Allen et al. (1998) modified the Penman–Monteith equation for estimation of grass reference crop evapotranspiration (ETo). The mathematicalrelationship is as follows:
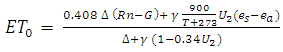 (25.6)
Where,
ETo = Reference crop evapotranspiration (mm/day)
Rn = Net radiation at the crop surface (MJ/m2/day)
G = Soil heat flux density (MJ/m2/day)
T = Air temperature at 2 m height (°C)
U2 = Wind speed at 2 m height (m/s)
es = Saturation vapour pressure (kPa)
ea = Actual vapour pressure (kPa)
(es – ea) = Saturation vapour pressure deficit (kPa)
Δ = Slope vapour pressure curve (kPa/°C)
γ = Psychrometric constant (kPa/°C)
Details of parameter estimation for the above ETo methods can be found in Allen et al. (1998) and Michael (2008).
Application & Limitations
- Method requires all weather data, i.e., minimum and maximum temperature, minimum and maximum RH, wind speed, Solar radiation or sunshine hour
- Wide applicability i.e., in arid, semi-arid, humid, sub-humid conditions
- Gives a very satisfactory estimate of ETo
- Can provide basis for developing consistent crop coefficients
25.4 Crop Evapotranspiration
Estimation of evapotranpiration for a specific crop (ETc) requires first calculating the reference evapotranspiration (ET0) and then multiplying the crop coefficients (Kc) to estimate actual:
ETc = ETo x Kc (25.7)
Where, ETc is the ET of a specific crop,ETo is the grass-reference ET, and Kc is the crop coefficient for a given crop.
25.4.1 Crop Coefficient Concept
While ETo accounts for variations in weather and is used as an indicator of atmospheric demand for water, Kc values account for the difference between EToand ETc and link them. Kc is the crop coefficient for a given crop and growth stage, and is usually determined experimentally. Each agronomic crop has a set of specific crop coefficients used to predict water use rates at different growth stages.
There are four main crop growth stages: initial, crop development, mid-season, and late season:
a) Initial period – planting to 10% ground cover
b) Crop development – 10% ground cover to effective cover i.e., flowering
c) Mid-season – Effective cover to start of maturity i.e., senescence of leaves
d) Late season – Start of maturity to harvest.
These crop development stages along with crop coefficient variation for a typical crop are depicted in Fig. 25.3.Tables 25.3 presents length of growth stages of some of the representative crops whereas Table 25.4 shows values of crop coefficient during different stages. Crop coefficient values vary with the development stage of the crop. In the case of annual crops, Kc is typically low at seedling, emergence and establishment stage, increaseswith increase in ground cover and attains maximum value at mid-season stage andthereafter decreases towards ripening and maturity stage.
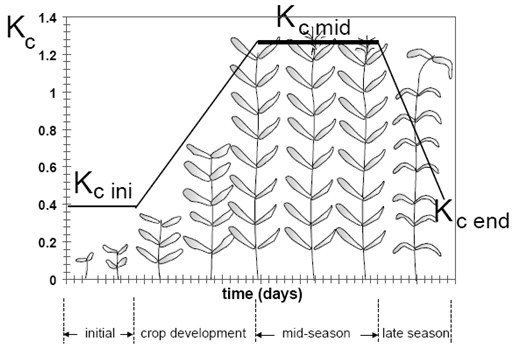
Fig. 25.3.Variation of crop coefficient with crop growth stages. (Source: Allen et al. 1998)
Table 7.7.Length of crop growth stages (days)
|
Crop |
Initial (Lini) |
Development (Ldev) |
Mid
(Lmid) |
Late
(Llat) |
Panting date |
Region |
|
Bean, green |
20 |
30 |
30 |
10 |
Feb/Mar |
Calif., Mediterrian |
|
Cabbage |
40 |
60 |
50 |
15 |
Sept |
Calif. Desert, USA |
|
Cauliflower |
35 |
50 |
40 |
15 |
Sept |
Calif. Desert, USA |
|
Tomato |
35 |
40 |
50 |
30 |
Apr/May |
Calif., USA |
|
Cucumber |
20 |
30 |
40 |
15 |
Jun/Aug |
Arid region |
|
Potato |
30 |
35 |
50 |
30 |
Apr |
Europe |
|
Groundnut |
35 |
35 |
35 |
35 |
May |
High Latitudes |
|
Lentil |
25 |
35 |
70 |
40 |
Oct/Nov |
Arid region |
|
Soybeans |
20 |
30/35 |
60 |
25 |
May |
Central USA |
|
Cotton |
30 |
50 |
60 |
55 |
Mar-May |
Egypt; Pakistan; Calif. |
|
Sesame |
20 |
30 |
40 |
20 |
Jun |
China |
|
Sunflower |
25 |
35 |
45 |
25 |
Apr/May |
Medit.; Calif. |
|
Wheat |
15 |
25 |
50 |
30 |
Nov |
Central India |
|
Maize (grain) |
20 |
35 |
40 |
30 |
Oct |
India (dry, cool) |
|
Rice |
30 |
30 |
60 |
30 |
Dec; May |
Tropics; Medit |
|
Sugarcane, ratoon |
30 |
50 |
180 |
60 |
|
Tropics |
|
Banana, Istyr |
120 |
90 |
120 |
60 |
Mar |
Mediterranean |
|
Grapes |
20 |
40 |
120 |
60 |
Apr |
Low Latitudes |
|
Citrus |
60 |
90 |
120 |
95 |
Jan |
Mediterranean |
(Source: Allen et. al, 1998)
Table 7.8.Single crop coefficients for grass reference crop and mean maximum plant heights for well managed no stressed condition in sub-humid regions (RHmin = 45% and u2 = 2 ms-1)
|
Crop |
Kc_ini |
Kc_mid |
Kc_end |
Maximum crop height, h (m) |
|
Bean, green |
0.5 |
1.05 |
0.90 |
0.4 |
|
Cabbage |
0.7 |
1.05 |
0.95 |
0.4 |
|
Cauliflower |
0.7 |
1.05 |
0.95 |
0.4 |
|
Tomato |
0.6 |
1.15 |
0.70 – 0.90 |
0.6 |
|
Cucumber |
0.5 |
1.00 |
0.90 |
0.3 |
|
Potato |
0.5 |
1.15 |
0.75 |
0.6 |
|
Groundnut |
0.4 |
1.15 |
0.60 |
0.4 |
|
Lentil |
0.4 |
1.10 |
0.30 |
0.5 |
|
Soybeans |
0.4 |
1.15 |
0.50 |
0.5-1.0 |
|
Cotton |
0.35 |
1.15-1.20 |
0.70-0.50 |
1.2-1.5 |
|
Sesame |
0.35 |
1.10 |
0.25 |
1.0 |
|
Sunflower |
0.35 |
1.0-1.15 |
0.35 |
2.0 |
|
Wheat |
0.3 |
1.15 |
0.25 – 0.40 |
1.0 |
|
Maize (grain) |
0.3 |
1.20 |
0.60, 0.35* |
2.0 |
|
Rice |
1.05 |
1.20 |
0.90-0.60 |
1 |
|
Sugarcane |
0.40 |
1.25 |
0.75 |
3 |
|
Banana, Istyr |
0.50 |
1.10 |
1.00 |
3 |
|
Grapes |
0.30 |
0.85 |
0.45 |
2 |
|
Citrus** |
0.65 |
0.60 |
0.65 |
3 |
(Source: Allen et. al., 1998)
* First and second values correspond to harvest at high grain moisture and at complete field dry conditions, respectively.
** No ground cover, 50% canopy
Example 25.1:
Determine ETo for March from pan evaporation data of Palakkad, Kerala. Daily mean pan evaporation for the month of March = 7.01mm, Average relative humidity = 63.45 %, Average wind speed at 2m height = 1.157 m/s. At Palakkad, evaporation pan is placed in an area surrounded by green crops. The windward side distance of green crops is about 100 m.
Solution:
For the given conditions, Kp from Table 25.2 is 0.8
ETo = Kp x Epan
= 0.8 x 7.01
= 5.61 mm. Ans
Example 25.2:
Determine monthly water requirements and total water requirement of a groundnut crop grown in the rice fallows at Palakkad, Kerala.
|
Month |
January |
February |
March |
April |
|
Kc Values |
0.51 |
0.93 |
1.14 |
0.82 |
|
ETo mm/day |
4.60 |
5.00 |
5.59 |
5.20 |
Solution:
For the month of January:
Kc =0.51
No of days =31
ETo = 4.60
Therefore, ETc = ETo x Kc x No of days
= 4.60 x 0.51 x 31
= 72.725 mm
For the month of February:
Kc =0.93
No of days =28
ETo = 5.00
Therefore, ETc = ETo x Kc x No of days
= 5.00 x 0.93 x 28
= 130.2 mm
For the month of March:
Kc =1.14
No of days =31
ETo = 5.59
Therefore, ETc = ETo x Kc x No of days
= 5.59 x 1.14 x 31
= 197.47 mm
For the month of April:
Kc =0.82
No of days =30
ETo = 5.20
Therefore, ETc = ETo x Kc x No of days
= 5.20 x 0.82 x 30
= 85.2 mm
Total water requirement = Jan +Feb+Mar+Apr = 485.72 mm Ans.
Irrigation requirement for the above months are calculated by subtracting monthly effective rainfall from ETc of respective months.
Key Words: Evapotranspiration, Crop coefficient
References
Allen R, G.,Pereira, L.S., Raes, D. and Smith, M. (1998). Crop evapotranspiration guidelines for computing crop water requirements. Irrigation and Drainage Paper 56, Food and Agriculture Organization of the United Nations (FAO), Rome, Italy.(www.kimberly.uidaho.edu/ref-et/fao56.pdf)
Doorenbos, J. and Pruitt, W. O.(1977). Guidelines for predicting crop water requirements.Irrig.and Drain. Paper No. 24, FAO, Rome, Italy.
Michael, A.M. (2008). Irrigation Theory and Practice. Vikas Publishing House PvtLtd. New Delhi.
Murty, V.V.N. (2002).Land and Water Management Engineering(Fourth Edition).Kalyani Publisher, New Delhi.
Internet References
http://www.angrau.ac.in/media/7380/agro201.pdf
http://gilley.tamu.edu/BAEN464/Handout%20Items/Cuenca%20Book%20Chapter%203%20Soil%20Physics.pdf
http://ilri.org/InfoServ/Webpub/fulldocs/IWMI_IPMSmodules/Module_3.pdf
ftp://ftp.wcc.nrcs.usda.gov/wntsc/waterMgt/irrigation/NEH15/ch1.pdf
Suggested Reading
Michael, A.M. (2008). Irrigation Theory and Practice. Vikas Publishing House Pvt.Ltd. New Delhi.
Murty, V.V.N. (2002).Land and Water Management Engineering(Fourth Edition).Kalyani Publisher, New Delhi.
http://www.angrau.ac.in/media/7380/agro201.pdf
http://gilley.tamu.edu/BAEN464/Handout%20Items/Cuenca%20Book%20Chapter%203%20Soil%20Physics.pdf
http://ilri.org/InfoServ/Webpub/fulldocs/IWMI_IPMSmodules/Module_3.pdf
ftp://ftp.wcc.nrcs.usda.gov/wntsc/waterMgt/irrigation/NEH15/ch1.pdf
Last modified: Saturday, 15 March 2014, 6:25 AM