Site pages
Current course
Participants
General
Module 1: Introduction and Concepts of Remote Sensing
Module 2: Sensors, Platforms and Tracking System
Module 3: Fundamentals of Aerial Photography
Module 4: Digital Image Processing
Module 5: Microwave and Radar System
Module 6: Geographic Information Systems (GIS)
Module 7: Data Models and Structures
Module 8: Map Projections and Datum
Module 9: Operations on Spatial Data
Module 10: Fundamentals of Global Positioning System
Lesson 2 Energy Sources and Interaction
2.1 Source of Energy
As noted earlier in lesson 1, the first requirement for remote sensing is to have an energy source to illuminate the target. Just as our eyes need objects to be illuminated by light so that we can see them, sensors also need a source of energy to illuminate the earth’s surface. The sun is the natural source of energy. This energy is in the form of electromagnetic radiation (EMR). The following subsections explain the classification of remote sensing.
Depending on the predominant source of electromagnetic energy in the remote sensing system, the remote sensing can be passive or active.
Passive Remote Sensing depends on a natural source to provide energy. The sun is the most commonly used source of energy for passive remote sensing. The satellite sensor in this case records primarily the radiation that is reflected from the target. Remote sensing in the visible part of the electromagnetic spectrum is an example of passive (reflected) remote sensing.
A portion of the sun’s radiation that is not reflected back to the sensor is absorbed by the target, raising the temperature of target material. The absorbed radiation is later emitted by the material at a different wavelength. Passive remote sensing can also be carried out in the absence of the sun. In this latter case, the source of energy is the target material itself and the sensor records primarily emitted radiation. Remote sensing in the thermal infrared portion of the electromagnetic spectrum is an example of passive (emitted) remote sensing.
Active Remote Sensing uses an artificial source for energy. For example the satellite itself can send a pulse of energy which can interact with the target. In active remote sensing, humans can control the nature (wavelength, power, duration) of the source energy. Remote sensing in the microwave region of the electromagnetic spectrum (radar remote sensing) is an example of active remote sensing. Active remote sensing can be carried out during day and night and in all weather conditions.
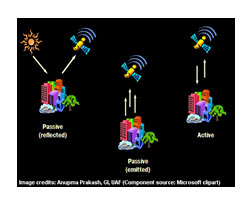
Fig. 2.1. Active and passive satellite sensors.
(Source: essedesignguide.org/index.php?option=com_content&task= view&id=165&Itemid=9 ; Aug16,2012.)
Remote Sensing Classification
Based on wavelength regions the remote sensing can be classified as:
Visible and reflective infrared remote sensing.
Thermal infrared or emitted remote sensing.
Microwave remote sensing.
The energy source used in the visible and reflective infrared remote sensing is the sun. The sun radiates EM energy with a peak wavelength of about 0.5 μm. Remote sensing data obtained in the visible and reflective infrared regions mainly depends on the reflectance of objects on the ground surface. Therefore, information about objects can be obtained from the spectral reflectance. However laser radar is exceptional because it does not use the solar energy but the laser energy of the sensor.
The source of the radiant energy in the thermal infrared remote sensing is the object itself, because any object with a normal temperature of about 27oC will emit EM radiation with a peak at about 9.7 μ m.
In microwave region, there are two types of microwave remote sensing, passive microwave remote sensing and active microwave remote sensing. In passive microwave remote sensing, the microwave radiation emitted from an object is detected, while the back scattering co-efficient is detected in active microwave sensing (www.jars1974.net/pdf/02_Chapter01.pdf).
2.2 Energy Interaction with Atmosphere
Irrespective of source, all radiation detected by remote sensors passes through some distance, or path length of atmosphere. The path length involved can vary widely. For example, space photography results from sunlight that passes through the full thickness of the earth’s atmosphere twice on its journey from source to sensor. On the other hand, an airborne thermal sensor detects energy emitted directly from objects on the earth, so a single, relatively short atmospheric path length is involved. The net effect of the atmosphere varies with these differences in path length and also varies with the magnitude of the energy signal being sensed, the atmospheric conditions present, and the wavelengths involved.
These effects are caused principally through the mechanisms of absorption, atmospheric scattering and reflection.
Absorption
Absorption is the process by which radiant energy is absorbed and converted into other forms of energy. The absorption of the incident radiant energy may take place in the atmosphere and on the terrain. An absorption band is a range of wavelengths (or frequencies) in the electromagnetic spectrum within which radiant energy is absorbed by a substance. The cumulative effect of the absorption by the various constituents can cause the atmosphere to close down completely in certain regions of the spectrum. This is not desired for remote sensing as no energy is available to be sensed.
Ozone, carbon dioxide, and water vapour are the three main atmospheric constituents that absorb radiation. Ozone serves to absorb the harmful (to most living things) ultraviolet radiation from the sun. Without this protective layer in the atmosphere our skin would burn when exposed to sunlight.
Carbon dioxide referred to as a greenhouse gas. This is because it tends to absorb radiation strongly in the far infrared (thermal infrared) portion of the spectrum –area associated with thermal heating –which serves to trap this heat inside the atmosphere. The water vapour in the atmosphere absorbs much of the incoming long wave (thermal) infrared and shortwave microwave radiations. The presence of water vapour in the lower atmosphere varies greatly from location to location and at different times of the year.
Scattering
Scattering is unpredictable diffusion of electromagnetic radiation by atmospheric particles. It occurs when particles or large gas molecules present in the atmosphere interact with and cause the EMR to be redirected from its original path. The amount of scattering takes place depends on several factors including the wavelength of the radiation, the diameter of particles or gases, and the distance the radiation travels through the atmosphere. There are two classes of scattering – selective and non- selective.
Selective scattering: There are three types of selective scattering Rayleigh scattering, Mie scattering, and Raman scattering:
Rayleigh scattering (sometimes referred to as molecular scattering) occurs when the effective diameter of the matter (usually air molecules air molecules such as oxygen and nitrogen in the atmosphere) is many times (usually< 0.1 times) smaller than the wavelength of the incident EMR. The amount of scattering is inversely related to the fourth power of wavelength of radiation. For example, ultraviolet light at 0.3 µm most Rayleigh scattering takes place in the upper 4.5 km of the atmosphere. It is responsible for the blue appearance of the sky. The shorter violet and blue wavelengths are more efficiently scattered than the longer green and red wavelengths. That is why most remote sensing systems avoid detecting and recording wavelengths in the ultraviolet and blue portions of the spectrum.
Mie Scattering (also referred to as non – molecular scattering) takes place in the lower 4.5 km of the atmosphere, where there may be many essentially spherical particles present with diameters approximately equal to the size of the wavelength of the incident energy. The actual size of the particles may range from 0.1 to 10 times the wavelength of the incident energy. For visible light, the main scattering agents are dust and other particles ranging from a few tenths of the micrometer to several micrometers in diameter. Fig. 2.2 shows the scattering of electromagnetic radiation.
Raman Scattering is caused by atmospheric particles, which are larger, smaller, or equal to that of the wavelength of the radiation being sensed. The atmospheric particles may be gaseous molecules, water droplets, fumes, or dust particles. These portions have an elastic collision with the atmospheric particles which result in either loss or gain of energy and thus an increase or decrease in wavelength.
Non- Selective Scattering takes place in the lowest portions of the atmosphere where there are particles greater than 10 times the wavelength of the incident EMR. This type of scattering is non- selective, that is, all wavelength of light are scattered, not just blue, green, or red. Thus, that is water droplets and ice crystals that make up clouds and fog banks scatter all wavelengths of visible light equally well, causing the cloud to appear white, (blue + green + red light = white light).
Refraction
Refraction is the deflection of EM radiation as it passes from one medium with one refractive index to a medium with a different refractive index. Refractive index is defined as the ratio or the speed of light in a vacuum to the speed of light in the medium and is calculated by
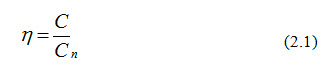
n = Refractive index.
C = Speed of light in vacuum.
Cn = Speed of light in medium.
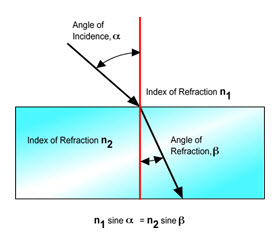
Fig. 2.3. Refraction of EM wave. (Source: chemicalparadigms.wikispaces.com/Unit+2+Refraction+of+light)
In the Earth's atmosphere temperature, compositions and humidity all affect the density which affects the refractive index. Serious errors in location due to refraction can occur in images formed from energy detected at high altitude or at acute angle. However, these location errors are predictable by Snell’s law and can be removed.
The angle that the radiation (Fig. 2.3) will be bent is defined by Snells Law:
n1sinα=n2sinβ (2.2)
n1=refractive index of first medium.
n2= refractive index of second medium.
sinα = angle of incidence.
sinβ =angle of refraction.
Reflection
Reflection is the process whereby radiation ‘bounces off’ an object like the top of a cloud, a water body, or the terrestrial earth. Reflection differs from scattering in that the direction associated with scattering is unpredictable but in case of reflection it is predicable. Reflection exhibits fundamental characteristics that are important in the remote sensing. First, the incident radiation, the reflected radiation and a vertical to the surface from which the angle of incident and reflection are measured all lie in the same plane. Second, the angle of incidence and the angle of reflection are approximately equal.
A considerable amount of incident radiant flux from the sun is reflected from the top of clouds and other material in the atmosphere. A substantial amount of this energy is reradiated back to space. The reflection principles that apply to clouds also apply to the terrain.
2.2.1 Energy Interactions with Earth Surface Features
When electromagnetic energy is incident on any given earth surface feature, three fundamental energy interactions with the feature are possible. This is illustrated in Fig. 2.4 for an element of the volume of a water body. Various fractions of the energy incident on the element are reflected, absorbed, and/ or transmitted. The amount of radiant energy onto, off of, or through a surface per unit time is called radiant flux (Φ) and is measured in watts (W).
Applying the principle of conservation of energy, the interrelationship between these three energy interactions can be expressed as
E1 (λ) =ER (λ) +EA (λ) +ET (λ) (2.3)
where,
E1 = incident energy
ER = reflected energy
EA = absorbed energy
ET = transmitted energy
All energy components are function of wavelength λ.
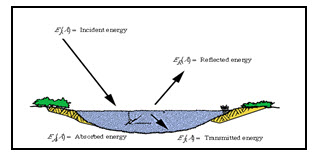
Fig. 2.4. Basic interactions between electromagnetic energy and an earth surface. (Source: Lillesand, Kiefer, 2002)
In above equation two points concerning this relationship should be noted. First, the proportions of energy reflected, absorbed, and transmitted will vary for different earth features, depending on their material type and condition. These differences permit us to distinguish different features on an image. Second, the wavelength dependency means that, even within a given feature type, the proportion of reflected, absorbed, and transmitted energy will vary at different wavelengths. Thus, two features may be indistinguishable in one spectral range and be very different in another wavelength band.
In remote sensing the radiation reflected from targets. We refer to two types of reflection is measured reflection from a target: can be specular reflection and diffuse reflection. For a smooth surface specular or mirror-like reflection occurs where all (or almost all) of the energy is directed away from the surface in a single direction. Diffuse reflection occurs when the surface is rough and the energy is reflected almost uniformly in all directions. Most earth surface features lie somewhere between perfectly specular or perfectly diffuse reflectors. Fig’s 2.5 and 2.6 illustrate specular and diffused reflection. Whether a particular target reflects specularly or diffusely, or somewhere in between, depends on the surface roughness of the feature in comparison to the wavelength of the incoming radiation. If the wavelengths are much smaller than the surface variations or the particle sizes that make up the surface, diffuse reflection will dominate. For example, fine-grained sand would appear fairly smooth to long wavelength microwaves but would appear quite rough to the visible wavelengths.
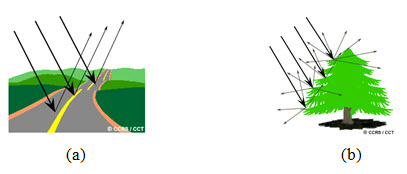
Fig. 2.5. (a) Specular Reflection and (b) Diffuse Reflection. (Source: www.cps-amu.org/sf/notes/mw4-2-4.htm)
Diffuse reflections contain spectral information on the “color” of the reflecting surface, whereas specular reflections do not. Hence, in remote sensing, we are most often interested in measuring the diffuse reflectance properties of terrain features.
This is measured as a function of wavelength and is called spectral reflectance, ρ(λ).
It is can be expressed as
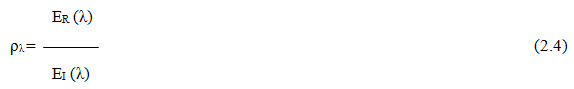
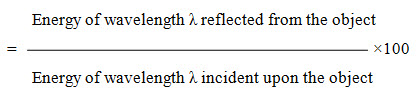
Where ρ(λ) is expressed as a percentage.
The spectral response of objects can be built from the measured reflected energy for different wavelengths. The spectral response of a material to different wavelengths of EMR can be represented graphically as a Spectral Reflectance Curve.
The comparison of spectral reflectance curves of different objects one can distinguish between them. For example, water and vegetation may reflect somewhat similarly in the visible wavelengths but are almost always separable in the infrared. Fig. 2.7 shows typical spectral reflectance curves for three basic types of earth features: healthy green vegetation, dry bare soil, and clear lake water. These curves indicate how much incident energy would be reflected from the surface, and subsequently recorded by a remote sensing instrument. At a given wavelength, the higher the reflectance, the brighter the object appears in an image.
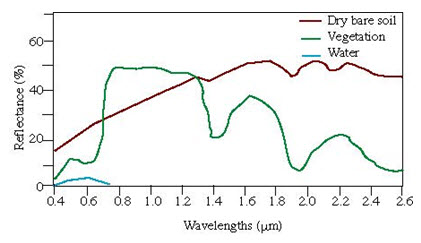
Fig. 2.7. Spectral reflectance curve.
(Source: www.ucalgary.ca/GEOG/Virtual/remoteintro.html)
Note that vegetation reflects much more energy in the near-infrared (0.8 to 1.4 microns) than it does in visible light (0.4 to 0.7 microns). The amount of energy that vegetation reflects is related to thle internal structure of the plant, and the amount of moisture in the plant. A surface like astro-turf, which is colored green, will appear dark in the near infrared, because it doesn't have the interna structure of living vegetation. Another feature to notice is that clear water reflects visible light only, so it will appear dark in infrared images.
Thus, to utilize remote sensing data effectively, one must know and understand the spectral characteristics of the particular features under investigation in any given application.
2.3 Data Acquisition and Interpretation
An image generated from an electronic sensor array is of a two-dimensional rectangular grid of numerical values that represent differing brightness levels. Each value represents the average brightness for a portion of the surface, represented by the square unit areas or grid in the image. The grid is a group of cells or pixels. When displayed on your computer, the brightness values in the image raster are translated into display brightness on the screen.
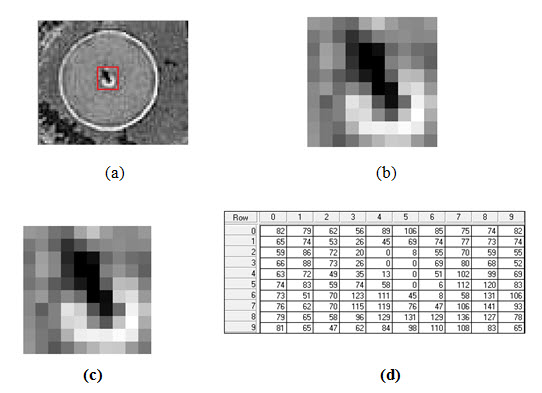 Fig. 2.8. Basic character of digital image data. (a) Original 563 rows × 468 columns digital image. (b) Enlargement showing 9 rows ×9 columns area of pixels showing in a red box in (a). (c) 9 rows × 9 columns enlargement. (d) Digital numbers corresponding to the radiance of each pixel shown in (c).
The basic characteristics of digital image data is illustrated in Fig. 2.8, though the image shown in (a) appears to be a continuous tone photograph, it is actually composed of a two dimensional array of discrete picture elements, or pixels. The intensity of each pixel corresponds to the average brightness, or radiance, measured electronically over the ground area corresponding to each pixel. A total of 320 rows and 480 columns of pixels are shown in Fig. 2.8 (a). Whereas the individual pixels are virtually impossible to discern in (a), they are readily observable in the enlargements shown in (b) and (c). Corresponding to the average radiance measured in each pixel shown in Fig. 2.8 (c). These values are simply positive integers that result from quantizing the original electrical signal form the sensor into positive integer values using a process called analog-to digital (A-to- D) signal conversion.
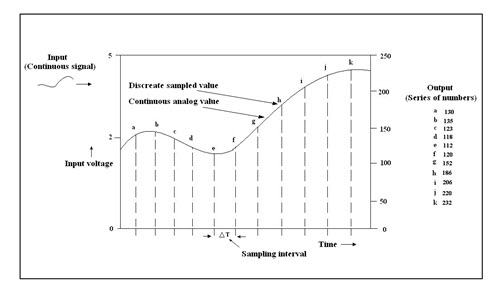
Fig. 2.9. Analog-to-digital conversion process.
The original electrical signal form the sensor is a continuous analog signal (shown by the continuous line plotted in the Fig. 2.9.). This continuous signal is sampled at a set time interval (ΔT) and recorded numerically at each sample point (a, b… j, k). The sampling rate for a particular signal is determined by the highest frequency of change in the signal. The sampling rate must be at least twice as high as the highest frequency present in the original signal in order to adequately represent the variation in the signal. Fig.2.9 is a graphical representation of the A-to-D conversion process.
Typically, the DNs constituting a digital image are recorded over such numerical ranges as 0 to 255, 0 to 511, 0 to 1023, or higher. These ranges represent the set of integers that can be recorded using 8-, 9-, and 10-bit binary computer coding scales, respectively. (That is 28 = 256, 29 = 512, and 210 = 1024.) In such numerical formats, the image data can be readily analyzed with the aid of a computer.
Data alone cannot be used for decision making. It must be interpreted or analyzed before one can extract information. The analysis of remotely sensed data is performed using a variety of image interpretation and processing techniques which fall into two broad categories: Analog (visual) image interpretation and Digital image interpretation (DIP).
Visual interpretation techniques have certain disadvantages, however, in that they may require extensive training and are labor intensive. In addition, spectral characteristics are not always fully evaluated in visual interpretation effort. This is partly because of the limited ability of the eye to discern tonal analyze numerous spectral images. In applications where spectral patterns are highly informative, it is therefore preferable to analyze digital, rather than pictorial, image data.
The use of computer- assisted analysis techniques permits the spectral patterns in remote sensing data to be more fully examined. It also permits the data analysis process to be largely automated, providing cost advantages over visual interpretation techniques. However, just as humans are somewhat limited in their ability to interpret spectral patterns, computers are somewhat limited in their ability to interpret spectral patterns. Therefore, visual and numerical techniques are complementary in nature, hence combination of both approaches are generally adopted.
2.4 Advantages of Remote Sensing
Remote sensing has several unique advantages as well as some limitations of remote sensing, to use it more effectively. Remote sensing is unobtrusive if the sensor is passively recording the EM energy reflected from or emitted by the phenomenon of interest. This is a very important consideration, as passive remote sensing (using natural source of energy, e.g., the sun) does not disturb the object or area of interest.
Under carefully controlled conditions, remote sensing can provide fundamental biophysical data, including: x,y location, z elevation or depth, biomass, temperature, moisture content, etc., in this sense, it is much like surveying, providing fundamental data that other sciences can use when conducting scientific investigations. However, unlike much of surveying, the remotely sensed data may be obtained systematically over very large geographic areas rather than just single point observation. The major advantages are stated below.
- Synoptic View
Remote sensing process facilitates the study of various earths’ surface features in their spatial relation to each other and helps to delineate the required features and phenomena. Data about the entire earth is obtained in a short period of time can be used for different purposes without taking permission.
- Repeativity
The remote sensing satellites provide repetitive coverage of the earth and this temporal information is very useful for studying landscape dynamics, phenological variations of vegetation and other land features and change detection analysis.
- Accessibility
Remote sensing process made it possible to gather information about the area when it is not possible to do ground survey like in mountainous areas and foreign areas. Passive remote sensing can be used in all weather and all time of a day.
- Time saving
Since information about a large area can be gathered quickly, the techniques save time and efforts of human. It also saves the time of fieldwork.
- Cost Effective
Remote sensing especially when conducted from space, is an intrinsically expensive activity. Nevertheless, cost-benefit analysis demonstrates its financial effectiveness, and much speculation or developmental remote sensing activity can be justified in this way. It is a cost-effective technique as again and again fieldwork is not required and also a large number of users of different disciplines can share and use the same data.
2.5 Limitations of Remote Sensing
Remote sensing science has various limitations. Perhaps the greatest limitation is that its utility is often oversold (Jensen 2004). It is not a panacea that will provide all the information needed for conducting physical, biological, or social science. It simply provides some spatial, spectral, and temporal information of value.
Human beings select the most appropriate sensor to collect the data, specify the resolution of the data, calibrate the sensor, select the platform that carry the sensor determine when the data will be collected, and specify how the data are processed. Thus, human method produced error may be introduced, as the various remote sensing instrument and mission parameters are specified (Jensen 2004).
Powerful active remote sensor system, such as lasers or radars that emit their own EMR, can be intrusive and affect that phenomenon being investigated.
Remote sensing instruments like in situ instruments often become uncalibrated, resulting in uncalibrated remote sensing data. Finally, remote sensors data may be expensive to collect, interpret, or analyze. But the information derived from the remote sensor data is so expensive that the expense is warranted.
The limitations of satellite remote sensing also include the inability of many sensors to obtain data and information through cloud cover (although microwave sensors can image earth through clouds) and the relatively low spatial resolution achievable with many satellite-borne earth remote sensing instruments. In addition, the need to correct for atmospheric absorption and scattering and for the absorption of radiation through water on the ground can make it difficult to obtain desired data and information on particular variables.
Keywords: Energy sources, absorption, scattering, specular, diffused reflector, spectral reflectance, Analogue to digital conversion.
Reference
chemicalparadigms.wikispaces.com/Unit+2+Refraction+of+light
Lillesand, T. M., Kiefer, R. W., 2002, Remote sensing and image interpretation, Fourth Edition, pp. 4-17, 23-27.
www.cps-amu.org/sf/notes/mw4-2-4.htm
www.ucalgary.ca/GEOG/Virtual/remoteintro.html
www.jars1974.net/pdf/02_Chapter01.pdf
Suggested Readings
Bhatta B., 2008, Remote Sensing and GIS, Oxford University press, New Delhi, pp. 8-9, 18-36.
www.cps-amu.org/sf/notes/mw4-2-2.htm, August 10, 2012
www.geo.mtu.edu/rs/back/energy/; August 16, 2012.
www.microimages.com/getstart/pdf/introrse.pdf
www.nap.edu/openbook.php?record_id=10257&page=24l, August 16, 2012.
Last modified: Tuesday, 21 January 2014, 5:23 AM