Site pages
Current course
Participants
General
Module 1: Introduction and Concepts of Remote Sensing
Module 2: Sensors, Platforms and Tracking System
Module 3: Fundamentals of Aerial Photography
Module 4: Digital Image Processing
Module 5: Microwave and Radar System
Module 6: Geographic Information Systems (GIS)
Module 7: Data Models and Structures
Module 8: Map Projections and Datum
Module 9: Operations on Spatial Data
Module 10: Fundamentals of Global Positioning System
Lesson 5 Sensors and Tracking System
5.1 Optical-Infrared Sensors
Optical infrared remote sensors are used to record reflected/emitted radiation of visible, near-middle and far infrared regions of electromagnetic radiation. They can observe for wavelength extend from 400-2000 nm. Sun is the source of optical remote sensing. There are two kinds of observation methods using optical sensors: visible/near infrared remote sensing and thermal infrared remote sensing.
a) Visible/Near Infrared Remote Sensing
In this observation method visible light and near infrared rays of sunlight reflected by objects on the ground is observed. The magnitude of reflection infer the conditions of land surface, e.g., plant species and their distribution, forest farm fields, rivers, lakes, urban areas etc. In the absence of sunlight or darkness, this method cannot be used.
b) Thermal Infrared Remote Sensing
In thermal infrared remote sensing, the land surface radiate heat due to interaction of earth surface with solar radiation. Also this is used to observe the high temperature areas, such as volcanic activities and forest fires. Based on the strength of radiation, one can surface temperatures of land and sea, and status of volcanic activities and forest fires. This method can observe at night when there is no cloud.
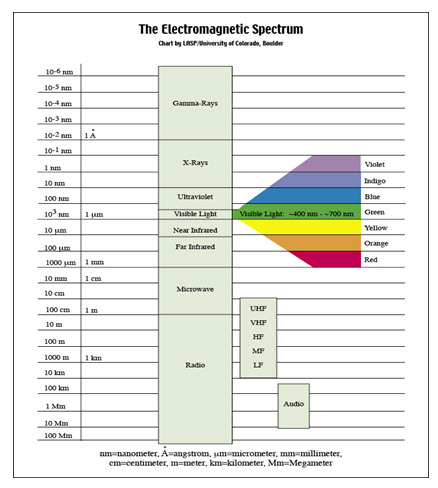
Fig. 5.1. Electromagnetic spectrum. (Source: lasp.colorado.edu/cassini/education/Electromagnetic%20 Spectrum.htm)
The optical remote sensing can be classified into panchromatic imaging system, multispectral imaging system and hyperspectral imaging system.
Panchromatic Imaging System
A single channel sensor with broad wavelength range is used to detect radiation within a broad wavelength range. In panchromatic band, visible and near infrared are included. The imagery appears as a black and white photograph. The color of the target is not available. Examples of panchromatic imaging system are Landsat ETM+ PAN, SPOT HRV-PAN and IKONOS PAN, IRS-1C, IRS-1D and CARTOSAT-2A. Spectral range of Panchromatic band of ETM+ is 0.52 µm to 0.9 µm, CARTOSAT-2B is 0.45-0.85 µm, SPOT is 0.45- 0.745 µm.
Multispectral imaging system
The multispectral imaging system uses a multichannel detectors and records radiation within a narrow range of wavelength. Both brightness and color informations are available on the image. LANDSAT, LANDSAT TM, SPOT HRV-XS and LISS etc are the examples.
Hyperspectral imaging system
Hyperspectral imaging system records the radiation of terrain in 100s of narrow spectral bands. Therefore the spectral signature of an object can be achieved accurately, helps in object identification more precisely. Example, Hyperion data is recorded in 242 spectral bands, and AVIRIS data is recorded in 224 spectral bands.
5.2 Microwave Sensors
The region Microwave sensors receive microwaves, which are longer wavelength than visible light and infrared rays, and observation is not affected by day, night or weather. Microwave portion of the spectrum includes wavelengths within the approximate range of 1 mm to1m. Thus, the longest microwaves are about 2,500,000 times longer than the shortest light waves. There are two types of observation methods using microwave sensor: active and passive.
a) Active sensor: The sensor emits microwaves and observes microwaves reflected by land surface features. It is used to observe mountains, valleys, surface of oceans wind, wave and ice conditions.
b) Passive sensor: This type of sensor records microwaves that naturally radiated from earth surface features. It is suitable to observe sea surface temperature, snow accumulation, thickness of ice, soil moisture and hydrological applications0 etc.
RISAT is an Indian remote sensing satellite provides microwave data.
5.3 Scanning Mechanism
Multispectral scanner images are acquired by means of along track or across track scanning system. Depending on the way of scanning, remote sensing scanner can be categorized as: across track (whiskbroom) and along track (push broom) scanning.
5.3.1 Across-track scanning
Multispectral scanning systems make two dimensional images of terrain for swath beneath the platform. Across track scanners scan the earth terrain in a series of lines. The lines are oriented in the direction perpendicular to the motion of the sensor platform (i.e. across the swath). Hence in across track scanning an optical-mechanical scanner (also known as whiskbroom scanner) scans along the swath from one side to another. Swath is width of the strip of a scene along the across track direction.
The MSS and thematic mapper (TM) of Landsat, and AVHRR of NOAA are the examples of optical-mechanical scanners.
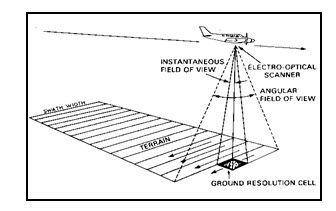
Fig. 5.1. Across track scanner.
(Source: www.fao.org/docrep/003/T0355E/T0355E04.htm)
Fig. 5.1. illustrates the operation of an across–track, or whiskbroom scanner. Such systems scan the terrain using a single or a set of detectors per band for recording the PAN and the multi-spectral signals respectively. Using a rotating or oscillating mirror, the detector starts looking at the adjacent element on the ground. Thus, information is collected pixel by pixel by the detector produce a strip or a scan line. Successive scan lines are covered as the aircraft moves forward, yielding a series of contiguous, or just touching, narrow strips of observation comprise a two dimensional image of rows (scan lines) and columns.
The length of time, the scanner “sees” the ground resolution cell is called dwell time within the system’s instantaneous field of view (IFOV). The total angle along a scan line or swath is termed as field of view (FOV). The IFOV is normally expressed as the cone angle (β) within which incident energy is focused on the detector. Radiance of all the land cover types or features included in the IFOV at any given instant will be recorded by the detector. Thus, a pixel typically contains the radiance of a single land cover type and multiple land cover types termed as pure pixel and mixed pixels respectively.
If H be the sensor platform height and β be the IFOV, the footprint (D) of the detector on the ground can be expressed as
D = Hβ (5.1)
The ground segment sensed at any instant is called the ground resolution element or ground resolution cell. The ground resolution cell is referred to as the system’s spatial resolution. For example, the spatial resolution (D) of a scanner having a 2.8588 –milliradian (mrad) IFOV and being operated from 822 km above the terrain will be 822×1000m ×(2.8588×10-5 rad)=23.5m.
A larger IFOV means a greater quantity of total energy is focused on a detector as the scanners mirror sweeps across a ground resolution cell. This permits more sensitive scene radiance measurements due to higher signal levels. The result is an improvement in the radiometric resolution, or the ability to discriminate very slight energy differences. Thus, there is a trade-off between high spatial resolution and high radiometric resolution in the design of multispectral scanner systems. A large IFOV yields a signal that is much greater than the background electronic noise (extraneous, unwanted responses) associated with any given system. Thus, other things being equal, a system with a large IFOV will have a higher signal-to-noise ratio than with a small IFOV. Again, this results from the fact that a large IFOV results in a longer dwell time. What is sacrificed for these higher signals levels is spatial resolution. In a similar vein, the signal-to-noise ratio can be increased by broadening the wavelength band over which a given detector operates.
5.3.2 Along-track scanning
To achieve better spatial / spectral resolution than those provided by opto-mechanical scanners, push broom imaging systems are currently being used, referred as along track scanning. In along track scanning the detector scans the terrain of earth in the flight direction directly beneath the platform. The detector scans the whole terrain equal to width of swath in a strip or line. To build up a two dimensional image by recording successive scan lines, the detectors are oriented at right angles to the flight direction.
However, there is a distinct difference between along track and across track systems in the manner in which each scan line is recorded. In an along- track system there is a mechanical scanning mirror for pixel by pixel scanning along the swath direction. Instead a mechanical scanning mirror, a linear array of detectors is used in along track scanning system scan the whole swath. Linear arrays typically consist of numerous charge coupled devices (CCDs) positioned end to end. Each detector element of an array measures the radiance for a single ground resolution cell. Thus the size and IFOV of a single detector determine spatial resolution of the system.
Linear array CCDs are designed to be very small and a single array may contain over 10,000 individual detectors. Each spectral band of sensing requires its own linear array. Normally, the arrays are located in the focal plane of the scanner such that each scan line is viewed by all arrays simultaneously.
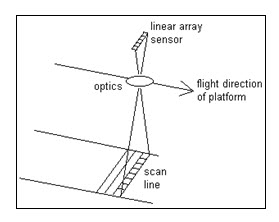
Fig. 5.2: Push broom scanner.
(Source: www.nln.geos.ed.ac.uk/courses/english/frs/f5300/f5300008.htm)
Linear array systems afford a number of advantages over across- track mirror scanning systems. First, linear arrays provide the opportunity for each detector to have a longer dwell time over which to measure the energy from each ground resolution cell. This enables a stronger signal to be recorded (and, thus, a higher signal to noise ratio) and a greater range in the signal levels that can be sensed, which leads to better radiometric resolution. In addition, the geometric integrity of linear array systems is better because of the fixed relationship among detector elements recording each scan line. The geometry along each row of data (scan line) is similar to an individual photo taken by an aerial camera. The geometric errors introduced into the sensing process by variations in the scan mirror velocity of across track scanners are not present in along track scanners. Because linear arrays are solid-state microelectronic devices, along track scanners are generally smaller in size and weight and require less power for their operation than across track scanners. Also, having no moving parts, a linear array system has higher reliability and longer life expectancy.
One disadvantage of linear array systems is the need to calibrate many more detectors. Another limitation is limited spectral range of detectors.
The first use of CCD- based pushbroom scanners on an unmanned earth-observing spacecraft was on the French SPOT-1 launched in 1986. All the LISS (Linear Imaging Self Scanning) sensors are equipped with linear array CCDs in IRS satellite sensor (IRS 1A, 1B, 1C & D).
Keywords: Sensor, Thermal Infra red, Microwave, Along track scanning, Across track scanning.
References
lasp.colorado.edu/cassini/education/Electromagnetic%20Spectrum.htm
www.fao.org/docrep/003/T0355E/T0355E04.htm
www.nln.geos.ed.ac.uk/courses/english/frs/f5300/f5300008.htm
Suggested Reading
Bhatta, B., (2008). Remote Sensing and GIS, Oxford University Press, New Delhi, pp. 127-136.
eoedu.belspo.be/en/satellites/irs.htm; Sep. 7, 2012
Lillesand, T. M., Kiefer, R. W., 2002, Remote Sensing and Image Interpretation. Fourth Edition, pp. 310-319.
stlab.iis.u-tokyo.ac.jp/~wataru/lecture/rsgis/rsnote/cp3/cp3-1.htm; Sep. 6, 2012
www.aprsaf.org/data/w_sea_data/March3%20Presentations/3_7Rao.pdf
www.crisp.nus.edu.sg/~research/tutorial/optical.htm; Sep. 7, 2012
Last modified: Tuesday, 21 January 2014, 5:49 AM