Site pages
Current course
Participants
General
Module 1: Introduction and Concepts of Remote Sensing
Module 2: Sensors, Platforms and Tracking System
Module 3: Fundamentals of Aerial Photography
Module 4: Digital Image Processing
Module 5: Microwave and Radar System
Module 6: Geographic Information Systems (GIS)
Module 7: Data Models and Structures
Module 8: Map Projections and Datum
Module 9: Operations on Spatial Data
Module 10: Fundamentals of Global Positioning System
Lesson 21 Map Projections
21.1 Introduction
Coordinate systems, also known as map projections, are arbitrary designations for spatial data. Their purpose is to provide a common basis for communication about a particular place or area on the earth's surface. The most critical issue in dealing with coordinate systems is knowing what the projection is and having the correct coordinate system information associated with a dataset. There are two types of coordinate systems - geographic and projected.
A geographic coordinate system uses a three-dimensional spherical surface to define locations on the earth. It includes an angular unit of measure, a prime meridian and a datum (based on a spheroid). In a geographic coordinate system, a point is referenced by its longitude and latitude values. Longitude and latitude are angles measured from the earth's center to a point on the earth's surface. The angles are often measured in degrees (or in radians). (http://webhelp.esri.com)
Map projections and datums have been described very comprehensively by many other authors and this topic is an extremely important one in the understanding of GIS construction and functionality, and as such cannot be ignored here. We therefore prefer to overview the main principles, concentrating on the practical applications, and refer the reader to other more detailed texts.
To make GIS function, we must be able to assign ‘coordinates’ of time and location in a way that is generally understood. Several terms are commonly used to denote the positioning of objects: georeference, geolocation, georegistration and geocoding. The main requirement for a georeference is that it is unique, to avoid any confusion. Hence the address, or georeference, of the Royal School of Mines, Prince Consort Road, London SW72AZ, United Kingdom, refers only to one building; no other in the world has this specific address. Georeferencing must also be persistent through time, again to avoid both confusion and expense. (Liu and Mason, 2009)
21.1.1 Datums and projections
The Earth is a 3D object, roughly oblately spherical in shape, and we need to represent that 3D shape in a 2D environment, on paper or on a computer screen. This is the reason for the existence of a multitude of map projections – since this cannot be done without distorting information, accurate measurements become potentially ambiguous. To achieve this 2D representation, two things need to be approximated: the shape of the Earth and the transformations necessary to plot a location’s position on the map. (Liu and Mason, 2009)
A projected coordinate system is defined on a flat, two-dimensional surface on a flat, two-dimensional surface .Unlike a geographic coordinate system; a projected coordinate system has constant lengths, angles, and areas across the two dimensions. A projected coordinate system is always based on a geographic coordinate system that is in turn based on a sphere or spheroid.
In a projected coordinate system, locations are identified by x and y coordinates on a grid, with the origin at the center of the grid. Each position has two values that reference it to that central location. One specifies its horizontal position and the other its vertical position.
When the first map projections were devised, it was assumed, incorrectly, that the earth was flat. Later the assumption was revised, and the earth was assumed to be a perfect sphere. In the 18th century, people began to realize that the earth was not perfectly round. This was the beginning of the concept of the cartographic spheroid.
To more accurately represent locations on the earth's surface, mapmakers studied the shape of the earth (geodesy) and created the concept of the spheroid. A datum links a spheroid to a particular portion of the earth's surface. Recent datums are designed to fit the entire earth's surface well.
The most commonly used datums in North America are:
NAD 1927 (North American Datum 1927) using the Clarke 1866 spheroid
NAD 1983 (North American Datum 1983) using the GRS 1980 spheroid
WGS 1984 (World Geodetic System 1984) using the WGS 1984 spheroid
Newer spheroids are developed from satellite measurements and are more accurate than those developed in the 19th and early 20th centuries. (http://webhelp.esri.com)
You will find that the terms "geographic coordinate system" and "datum" are used interchangeably (http://webhelp.esri.com). A geographic coordinate system (GCS) defines locations on the earth using a three-dimensional spherical surface. A GCS is often incorrectly called a datum, but a datum is only one part of a GCS. A GCS includes an angular unit of measure, a prime meridian, and a datum (based on a spheroid). A feature is referenced by its longitude and latitude values. Longitude and latitude are angles measured from the earth’s center to a point on the earth’s surface. (http://php.auburn.edu/academic/classes/fory/7470/lab08 projections.pdf)
The coordinates for a location will change depending on the datum and spheroid on which those coordinates are based, even if using the same map projection and projection parameters. (http://webhelp.esri.com).
For example, the geographic coordinates below are for the city of Bellingham, Washington, using 3 different datum:
Table 21.1 Geographic coordinates of Bellingham city
|
Datum |
Longitude |
Latitude |
|
NAD 1927 |
-122.466903686523 |
48.7440490722656 |
|
NAD 1983 |
-122.46818353793 |
48.7438798543649 |
|
WGS 1984 |
-122.46818353793 |
48.7438798534299 |
(Source: webhelp.esri)
21.2 Describing and Measuring the Earth
Geodesy (shape of the earth) developed for practical needs: It was always necessary to establish property lines, mainly for tax purposes. Roads and buildings need advance planning. The location of a nation's resources must be determined and recorded. To get from one place to another, we want to know which way and how far to go. We can outline these needs as follows:
CADASTRAL - property lines, taxes
CIVIL ENGINEERING - roads, buildings
RESOURCES - What? Where? How much?
NAVIGATION - Which way? How far?
For such needs it was assumed that the earth is flat – as long as we stay within our immediate vicinity. But for long distances and large areas, this simple assumption does not work.
It contradicts the following observations like:
The ancient seafarers had noticed that a boat coming in from the horizon is not in full view all at once; its superstructure is visible long before the hull is seen.
Traveling north at night, the north pole star appears to get higher in the sky, as measured from the horizon up and many more such deviations are there. So from all these observations scientists jumped into a conclusion that the earth is not flat rather curved or sphere.
(NOAA (National Oceanic and Atmospheric Administration),September 1997,NOAA Reprint of Basic Geodesy, Rockville Md. US Department of Commerce, United States of America.)
They describe the earth with many types of coordinate systems like:
(1) Global Cartesian coordinates (x, y, z) for the whole earth
(2) Geographic coordinates (ɸ, λ, z)
(3) Projected coordinates (x, y, z) on a local area of the earth’s surface
The z-coordinate in (1) and (3) is defined geometrically; in (2) the z-coordinate is defined gravitationally. (http://webhelp.esri.com).
The shape of the apart from the assumed sphere, shown below
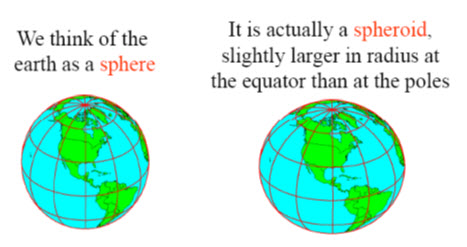
Fig. 21.1. Shows the shape of the earth. (Source: http://webhelp.esri.com).
The system of latitude and longitude is considered the most comprehensive and globally constant method of description and is often referred to as the geographic system of coordinates, or geodetic system, and it is the root for all other systems. It is based on the Earth’s rotation about its centre of mass.
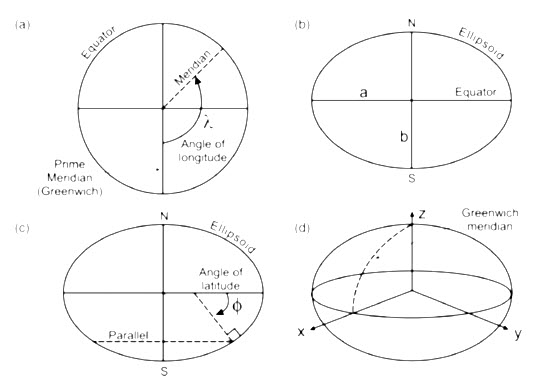 Fig. 21.2. Schematic representation of the Earth, looking (a) down the pole, perpendicular to the equator, (b) and (c) perpendicular to the pole from the equator, and (d) obliquely at the Earth. This illustrates the relationship between longitude and the meridians (a), between the equator and major and minor semi-axes (b), and between latitude and parallels (c), and the locations of the x, y and z axes forming Cartesian coordinates (d). (Source: Liu and Mason, 2009)
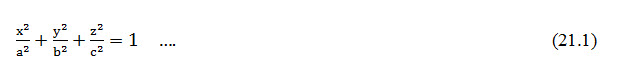
To define the centre of mass and so latitude and longitude (see Fig. 21.2), we must first define the Earth’s axis of rotation and the plane through the centre of mass perpendicular to the axis (the equator).Slices parallel to the axis but perpendicular to the plane of the equator are lines of constant longitude; these pass through the centre of mass and are sometimes also referred to as great circles. The slice through Greenwich defines zero degrees longitude and the angle between it and any other slice defines the angle of longitude, so that longitude then goes from 1800 west to 1800 east of Greenwich. A line of constant longitude is also called a meridian. Perpendicular to a meridian, a slice perpendicular to the axis and passing through the Earth but not through its centre is called a parallel, also referred to as a small circle, except for the equator (which is a great circle). We also need to describe the shape of the Earth, and the best approximation of this is the ellipsoid of rotation or spheroid. An ellipsoid is a type of quadric surface and is the 3D equivalent of an ellipse. It is defined, using x, y, z Cartesian coordinates, by
The Earth is not spherical but oblate and so the difference between the ellipsoid or spheroid and a perfect sphere is defined by its flattening (f), or its reduction in the shorter minor axis relative to the major axis. Eccentricity (e) is a further phenomenon which describes how the shape of an ellipsoid deviates from a sphere (the eccentricity of a circle being zero) (Liu and Mason, 2009). Flattening and eccentricity then have the following relationships:
An ellipse is defined by
Z Focal length = ɛ
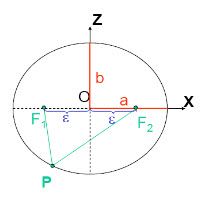
Fig. 21.3. Ellipse. (Source: http://webhelp.esri.com)
Distance (F1, P, F2) is constant for all points on ellipse
When ɛ = 0, ellipse = circle
For the earth: at point P
Major axis, a = 6378 km
Minor axis, b = 6357 km
![]()
~ 1/300
(Source: http://webhelp.esri.com)

Where a and b are the lengths of the major and minor axes respectively (usually referred to as semi-axes or half lengths of the axes). The actual flattening for the Earth’s case is about 1 part in 300. (Liu and Mason, 2009)
Table 21.2 Standard ellipse
|
Ellipsoid |
Major axis |
Minor axis |
Flattening ratio |
|
Clark (1886) |
6,378,206 |
6,356,584 |
1/294.98 |
|
GRS (80) |
6,378,137 |
6,356,752 |
1/298.57 |
(Source: webhelp.eseri)
21.2.1 Ellipsoid or Sphereoid
It is formed by rotating ellipse along an axis, as shown in Fig. 21.4
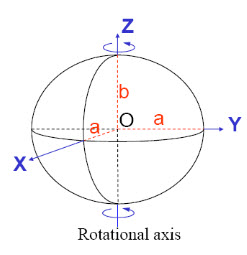
Fig .21.4. Ellipsoid or Spheroid formed by rotating ellipse around an axis. (Source: http://webhelp.esri.com)
Some of the first ellipsoids to be established were not particularly accurate and were not actually centered on the Earth’s centre of mass. Fortunately, and rather ironically, the Cold War, the nuclear arms race and the need to target intercontinental missiles helped to drive the development of an international standard ellipsoid. Out of all the datums defined in former pages, the World Geodetic System of 1984 (or WGS84) is now accepted as this standard although many others are in use.
21.2.2 Defining Latitude of earth
Latitude can now be defined as the angle between the equator and a line perpendicular to the ellipsoid, which ranges from 900 north or south of the equator (see Fig. 21.5). Latitude is commonly given the Greek symbol phi (ɸ). ) (Liu and Mason, 2009).
Or
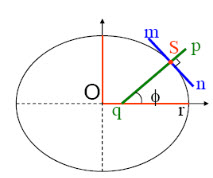
Fig. 21.5. Showing latitude of earth. (Source: http://webhelp.esri.com)
It can also be defined in this way also:
Take a point S on the surface of the ellipsoid and define there the tangent plane, mn.
Define the line pq through S and normal to the tangent plane
Angle pqr which this line makes with the equatorial plane is the latitude λ, of point S.
A line of constant latitude is known as a parallel. Parallels never meet since they are parallel to one another, whereas meridians (lines of longitude) converge at the poles. (Source: http://webhelp.esri.com)
21.2.3 Defining latitude of earth, λ
λ = the angle between a cutting plane on the prime meridian and the cutting plane on the meridian through the point
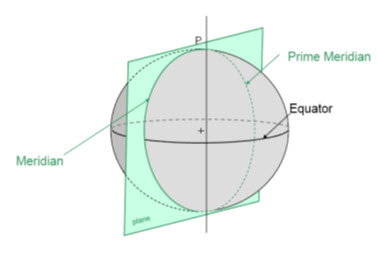
Fig. 21.6. Cutting plane of prime meridian. (Source: http://webhelp.esri.com)
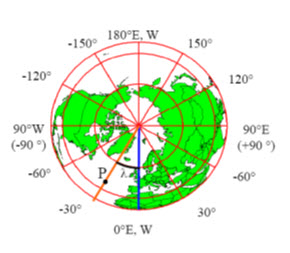
Fig .21.7. Showing the latitudes of earth. (Source: http://webhelp.esri.com)
Longitude is more complex and only east–west measurements made at the equator are true. Away from the equator, where the lines of latitude decrease in length, measures are increasingly shortened, by approximately the cosine of the latitude. This means that at 300 north (or south), shortening is about 0.866, 0.707 at 450 and 0.5 at 600.At 600 north or south, 10 of longitude will represents 55 km ground distance. (Liu and Mason, 2009).
21.2.4 Combined latitude and longitude on a sphere
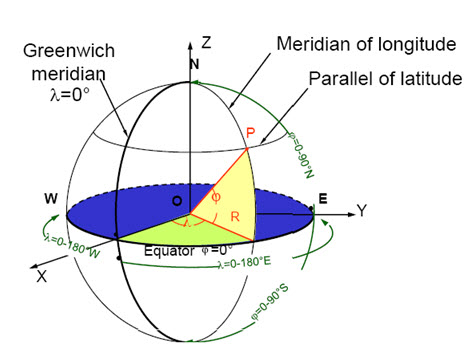
Fig.21.8. Showing latitude and longitude on a sphere.
(Source: http://webhelp.esri.com)
21.2.5 Length of meridians and parallels.
(Lat, Long) = (ɸ, λ), here considering the shape of the earth as spheroid and using geographic coordinates length of meridians and parallels are defined as:
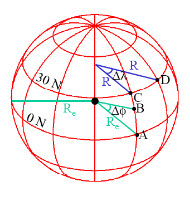
Fig.21.9. Showing the parallels and meridian length.
(Source: http://webhelp.esri.com)
Length on a Meridian:
AB = Re Δɸ (same for all latitudes) (21.4)
Length on a Parallel:
CD = R Δλ = Re Δλ Cosɸ (varies with latitude) (21.5)
Example: What is the length of 2º increment on a meridian and on a parallel at 30N, 90W? Radius of Earth = 6370km.
Solution:
First 2ºangle has to be converted into radians, π radians = 180º
So 1º = = = 0.0175 radians
Therefore, 2º = 0.035 radians
For the meridian, ΔL = Re Δɸ = 6370 * (0.035) = 222.96
For the parallel, ΔL = Re Δλ Cosɸ = 6370 *0.035* Cos30º
= 193.08km.
21.2.5 Curved Earth Distance (From A to B)
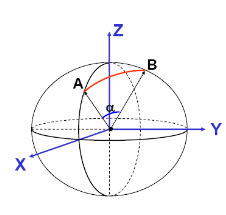
Fig.21.10 Curved surface of earth. (Source: http://webhelp.esri.com)
Shortest distance is along a “Great Circle” A “Great Circle” is the intersection of a sphere with a plane going through its AB center.
1. Spherical coordinates converted to Cartesian coordinates.
2. Vector dot product used to calculate angle α from latitude and longitude
3. Great circle distance is Rα, where R=6370 km2
![]()
Where latitude & longitude are λ and ɸ.
21.2.6 Measuring height: the geoid
The true shape of the Earth forms a surface which is perpendicular to the direction of gravity, and is described as an equipotential surface, in which there are fluctuations and irregularities according to variations in the density of the crust and mantle beneath. The spheroid or ellipsoid can therefore be thought of as a reasonable representation of the shape of the Earth but not the true shape; this we refer to as the geoid and it is defined as an ‘equipotential surface which most closely resembles mean sea level.
Or
The geoid is a surface of constant potential energy that coincides with mean sea level over the oceans. This definition is not very rigorous. First, mean sea level is not quite a surface of constant potential due to dynamic processes within the ocean. Second, the actual equipotential surface under continents is warped by the gravitational attraction of the overlying mass. But geodesists define the geoid as though that mass were always underneath the geoid instead of above it. The main function of the geoid in geodesy is to serve as a reference surface for leveling. The elevation measured by leveling is relative to the geoid.
(http://www.ceri.memphis.edu/people/smalley/ESCI7355/Li_G_Tut.pdf)
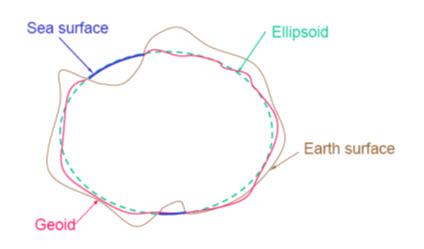
Fig. 21.9 Representation of earth. (Source: http://webhelp.esri.com)
Mean sea level is used in this context since it refers to everywhere and is a surface perpendicular to gravity. In general, differences between mean sea level and the geoid (referred to as separation) are greatest where undulations in the terrain surface are of the greatest magnitude but are generally less than 1 m.
The significance of the geoid’s variability is that it leads to different definitions of height from one place to another, since mean sea level also varies. Different countries may define slightly different equipotential surfaces as their reference. We should therefore take some care to distinguish between heights above geoid or spheroid (Fig. 21.8).
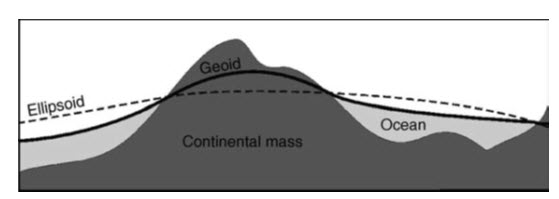
Fig. 21.10. Heights above the spheroid and geoid. (Source: Liu and Mason, 2009)
Fortunately the differences are small so that only highly precise engineering applications should be affected by them. For reference, orthometric heights and spheroidal heights are those defined with respect to the geoid and spheroid respectively. The variation in height from the geoid gives us topography. (Liu and Mason, 2009)
Keywords: CADASTRAL, NAVIGATION, NOAA, Ellipsoid, Sphereoid, Geoid.
References
Liu, J.G., and Mason, P.J. (2009). Mason P.J, Essential Image Processing and GIS For Remote Sensing; Imperial college, London,UK
NOAA (National Occeanic and Atmospheric Administration),September 1997, NOAA Reprint of Basic Geodesy, Rockville Md. US Department of Commerce, United States of America.
http://php.auburn.edu/academic/classes/fory/7470/lab08 projections.pdf
http://www.ceri.memphis.edu/people/smalley/ESCI7355/Li_G_Tut.pdf
Suggested Reading
http://www.csc.noaa.gov/digitalcoast/_/elearning/datums/player.html
http://www.nationalatlas.gov/articles/mapping/a_projections.html
Last modified: Friday, 31 January 2014, 6:25 AM