Site pages
Current course
Participants
General
Module 1: Fundamentals of Reservoir and Farm Ponds
Module 2: Basic Design Aspect of Reservoir and Far...
Module 3: Seepage and Stability Analysis of Reserv...
Module 4: Construction of Reservoir and Farm Ponds
Module 5: Economic Analysis of Farm Pond and Reser...
Module 6: Miscellaneous Aspects on Reservoir and F...
Lesson 28 Economic Indicators
In any economic analysis generally four main indicators are studied. These are discussed below:
28.1 Net Present Value
Net present value (NPV), also referred to as the bottom line or net income or net profit, is a measure of the profitability of a venture or project after accounting for all costs. This term results from the traditional appearance of an income statement which shows all allocated revenues and expenses over a specified period with the resulting summation on the bottom line of the report.
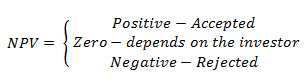
In simplistic terms, NPV is the money left over after paying all the expenses of an endeavor or a project. The accountant must itemize and allocate revenues and expenses properly to the specific working scope and context in which the term is applied. The acceptance or rejection of the project depends upon the fiscal value of NPV as under:
Thus, the NPV of the OFP irrigation project is computed as under:

Where, NPV = net present value of the OFP irrigation project, Rs.
28.2 Benefit Cost-ratio
Cost-benefit analysis is one of a set of formal tools of efficiency assessment. Efficiency assessment refers to analyses made for the purpose of identifying how to use scarce resources to obtain the greatest possible benefits of them. Cost-benefit analysis is a technique which is based on welfare economics. Benefit-cost ratio (BCR) is an indicator used in the formal discipline of cost-benefit analysis to summarize the overall value for money of a project. A BCR is the ratio of the benefits of a project, expressed in monetary terms, relative to its costs, also expressed in monetary terms. All benefits and costs should be expressed in discounted present values. The higher the BCR, the better is the investment. General rule of thumb is that if the benefit is higher than the cost, then it is wise to invest in the project. In OFP irrigation project, the BCR is expressed as:
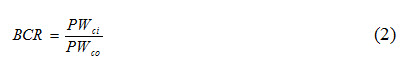
BCR more than 1 suggests acceptance of the OFP irrigation system and less than 1 is the criterion for rejection. Among BCR values more than 1, the highest value is more acceptable.
The main steps of a cost-benefit analysis are as follows:
Develop measures or programmes intended to help reduce a certain problem.
Develop alternative policy options for the use of each measure or programme.
Describe a reference scenario (sometimes referred to as business-as-usual or the do-nothing alternative).
Identify relevant impacts of each measure or programme. There will usually be several relevant impacts.
Estimate the impacts of each measure or programme in “natural” units (physical terms) for each policy option.
Obtain estimates of the costs of each measure or programme for each policy option.
Convert estimated impacts to monetary terms, applying available valuations of these impacts.
Compare benefits and costs for each policy option for each measure or programme.
Identify options in which benefits are greater than costs.
Conduct a sensitivity analysis or a formal assessment of the uncertainty of estimated benefits and costs.
Recommend cost-effective policy options for implementation.
28.3 Internal Rate of Return
The Internal rate of return (IRR) is a rate of return on an investment. The IRR of an investment is the interest rate at which the net present value becomes zero. The IRR can be considered as the expected rate of growth to be generated in a project. It is an indicator of the efficiency, quality, and yield of an investment.
When IRR is below the rate of interest levied by the bank, the project should be rejected. This is in contrast with the net present value, which is an indicator of the value or magnitude of an investment. An investment is considered acceptable if its internal rate of return is greater than an established minimum acceptable rate of interest levied by the lending agency. Generally speaking, the higher a project's internal rate of return, the more desirable it is to undertake the project. Internal rate of return (IRR) is computed as that interest at which the BCR value is just 1.0.
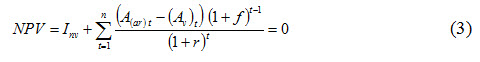
The ‘r’ value in Eq. 3, for which the net present value becomes zero, is called the IRR of the investment. For example, the amount invested in a project (say Rs.1, 00,000/-) if would have been fixed in some bank or invested otherwise in share market, the bank or the share market returns back the amount with 10% (say) rate of interest. If the project where the amount is invested does not return back the amount with more than 10% rate of interest, then the project is rejected. In reverse if it is more than 10%, then it is accepted.
28.4 Payback Period
Payback period (PBP) is one of the simplest investment appraisal techniques. It is the time required to pay back the loan or the time at which the present worth of cash inflows equals or just exceeds the present value of cash outflow. The OFP irrigation system is accepted when the payback period is less than the life span of the OFP. Quicker the payback period, higher is the potential of the project.
Payback period is calculated by subtracting the present worth of annual net return year-wise from the initial investment starting from the first year. The year in which the annual net return exceeds the initial investment is considered as the payback period of the investment. The project is accepted subject to PBP less than the life span of the project otherwise the project is rejected.

The year in which the value in Eq. 4 becomes positive is assumed to be the payback period of the investment. For example, if Rs.1,00,000/- is invested initially in a project and the amount is paid back from the annual returns in 5 years, then the PBP of the project is 5 years.
Keywords: Economic Indicators, Net present value, Benefit-cost ratio, Internal Rate of Return, Payback Period
References
Sahoo, B.C. (2010). Optimal sizing of On-farm Pond for various crop substitution ratios in rainfed uplands. Unpublished Ph.D. thesis submitted to IIT, Kharagpur.
Last modified: Tuesday, 4 February 2014, 10:20 AM