Site pages
Current course
Participants
General
Module 1 - Water availability and demand and Natio...
Module 2 - Irrigation projects and schemes of India
Module 3 - Concepts and definitions
Module 4 - Command Area Development and Water Mana...
Module 5 - On-Farm-Development works
Module 6 - Water Productivity
Module 7 - Tank & Tube well irrigation
Module 8 - Remote Sensing and GIS in Water Management
Module 9 - Participatory Irrigation Management
Module 10 - Water Pricing & Auditing
LESSON 23. Water Productivity Vs Scale of references under different irrigation systems – case study results
Water productivity under different scale levels viz., plant, field and distributory level were studied in three different irrigation systems viz., canal, tank and well irrigation. In canal irrigation system, four river basin areas of Tamil Nadu viz., Parambikulam Aliyar Project (PAP), Lower Bhavani Project (LBP), Periyar Vaigai and Tampiraparani river basins were taken to work out the water productivity at different scale of references. Data were collected using field visits to the canal commands and also necessary information was collected from the project records. Wherever possible measurement were taken and verified. In canal irrigation system, ground nut is a predominant crop in Parambikulam Aliyar Project (PAP), whereas in the other three river basins rice is the major crop. The details of water productivity under different scale level in various irrigation systems are presented in Table 23.1. The detailed calculations are given for PAP is presented below. For other computation details please refer to
23.1 WORKSHEET - WATER PRODUCTIVITY IN PAP
Name of the river basin : Parambikulam Aliyar Project
Name of the branch canal : (15.4 Km) Udukkampalayam
Name of the distributory : 3rd right Udukkampalayam
Total command area of the distributory: 27.80 Acres
Discharge rate of the distributory : 101.52 lits/sec
Base period of water flow : 135 days
Break in water flow : once in 16 days, one week break
Length of the distributory : 1.2 Km
Number of wells : 24
Number of bore wells : 46
Name of study area : Udukkampalayam
Major crops : Groundnut, Coconut
I. Plant/crop level
Name of the crop : Groundnut
Variety : ALR-2
Duration : 105 days
Productivity : 1700 kg /ha or 680 kg /acre
Season : Dec-March (Margali pattam)
Crop Co-efficient value : 0.4:1.1:0.3 for initial, mid and end
period Total crop evapotranspiration : Pan evaporation X Crop Co-efficient
factor Early stage (0-35 days) : 53.2 mm
Mid stage (36-90 days) : 351.45 mm End
stage (91-105 days) : 29.25 mm Total
Crop ET : 433.9 mm
Individual plant yield:
(Yield acre-1/No. of plants acre-1): 680 kg/ 1, 33,333.33 =0.0051 kg
Individual plant consumptive use:
(Total crop ET acre-1/No. of plants acre-1):1735.6 m3/1, 33,333.33=0.013m3
Individual plant net economic yield:
(Net profit acre-1/ No. of plants acre-1): Rs.4160/ 1, 33,333.33 = Rs.0.0312
Physical water productivity:
(Yield/consumptive use): 0.0051 kg/0.013 m3 =0.39 kg/ m3 of water
Economic water productivity:
(Net profit/consumptive use): Rs.0.0312/0.013 m3 = Rs. 2.40 /m3 of water
II. Field/farm level
Name of the crop : Groundnut
Area : one acre
Soil type : Black sandy lam
Average farm yield : 680 kg / acre
Price of produce : Rs. 12 / kg
Irrigation source : Canal water + ground water
Irrigation method : Surface irrigation
Total quantity of irrigation water:
Canal source
Discharge rate from channel to field X Hours/irrigation X No. of irrigation.
= 12 (lits/sec) X 3600X6.5 (hours per irrigation) X 5(irrigations)
= 1404 m3
Groundwater source:
Discharge rate motor pump X Hours/irrigation X No. of irrigation.
= 12 (l/s) X 3600X6.5 (hours per irrigation) X 6(irrigations)
= 1684.8 m3
Total water used for irrigation: Canal source + groundwater source = 3650.4 m3
Effective rainfall during crop period: 75 mm = 300 m3 / acre of land
Total water used for raising groundnut: total irrigation water + effective rainfall
= 1404+1684.4 + 300
= 3388.8 m3
Physical water productivity:
Average farm yield (kg/acre)/ total water used for raising particular crop (m3)
= 680/3388.8
= 0.20 kg / m3 of water
Economic water productivity:
(Net profit (Rs./acre) / total water used for raising particular crop (m3)
= Rs. (8160-4000)/ 3388.8 m3
= Rs. 1.23 /m3 of water
III. Distributory level
Distributory discharge rate
The discharge rate was calculated by using Manning’s formula
Q = (b + zd) d * (1/n) * (d/2) (2/3) * √S
Where,
b – bottom width of channel
z- slope of the channel
d – depth of water flow
Q- Discharge rate
Q = (0.3+(1*0.3))0.3 * (1/ 0.025) * 0.15 (2/3) *√ (0.025)
= 101.52 l /s
Total water discharged from the channel
= discharge rate X Base period of water flow
= 101.52 X 85 X 24 X 3600
= 745562.9 m3
Groundwater source:
For groundnut = quantity of water used /acre X total crop area
= 1684.8 X 48 = 80870.4 m3
For coconut = 4020 X 83 = 333660 m3
Total water used for irrigation:
Effective rainfall from distributory during cropping period: (70 % of total rainfall is assumed as effective rainfall)
For groundnut = Effective Rainfall /Cropped area
= 70 mm X 48 acres = 13440 m3
For coconut = 487.2 X 83 = 161750.4 m3
Actual water used for raising crop = canal water + ground water + Effective rainfall = 745562.9 + 414530.4 + 175190.4 = 1335283.7 m3
Distributory output
Total groundnut production in the distributory = 40411.25 kg
Coconut production = 5810000 nuts and
it was converted to groundnut equivalent yield = 484166.6 kg
Total output = 185661.25 kg groundnut equivalent yield
Physical water productivity:
Total economic production from the distributory (kg) / total water used in the distributor (m3) = 185661.25 kg/ 1335283.7 m3 of water
= 0.14 kg / m3 of water
Economic water productivity:
(Net profit from the distributory / total water used in the distributory (m3)
(Total groundnut equivalent yield was divided by per acre yield (680 kg) to get total number of groundnut area (273.03 acres) and per acre net income (Rs.4160) was multiplied with that area. So, total net profit was Rs.1135810.
= Rs.1135810/ 1335283.7 m3
= Rs.0.85 /m3 of water
Table 23.1. Physical and economic water productivity under different irrigation systems with different scale of reference in Tamil Nadu
|
Scale of References |
Total water used (m3) |
Output |
Water Productivity |
||
|
Physical (kg) |
Economic (Rs.) |
Physical (kg/m3) |
Economic (Rs./m3) |
||
|
I. Canal system |
|||||
|
1. Parambikulam Aliyar Project (PAP) |
|||||
|
Plant/ crop level |
0.013 |
0.0051 |
0.0312 |
0.39 |
2.40 |
|
Field level (0.4 ha) |
3388.8 |
680 |
4160 |
0.20 |
1.23 |
|
Distributory level |
1335283.7 |
185661 |
1135810 |
0.14 |
0.85 |
|
2. Lowe Bhavani Project (LBP) |
|||||
|
Plant/ crop level |
0.0180 |
0.0131 |
0.029 |
0.73 |
1.61 |
|
Field level (0.4 ha) |
5473.5 |
2200 |
7000 |
0.40 |
1.28 |
|
Distributory level |
833824.4 |
213796 |
621952 |
0.26 |
0.75 |
|
3. Vaigai River Basin |
|||||
|
Plant/ crop level |
0.020 |
0.014 |
0.033 |
0.70 |
1.65 |
|
Field level (0.4 ha) |
6931.25 |
1650 |
4390 |
0.24 |
0.63 |
|
Distributory level |
2486534.4 |
396000 |
1053600 |
0.16 |
0.42 |
|
4. Tampiraparani River Basin |
|||||
|
Plant/ crop level |
0.028 |
0.017 |
0.068 |
0.60 |
2.43 |
|
Field level (0.4 ha) |
7909.4 |
2100 |
7100 |
0.27 |
0.90 |
|
Distributory level |
37647968.0 |
3549038 |
12066949.5 |
0.09 |
0.30 |
|
II. Tank system |
|||||
|
Plant/ crop level |
0.0202 |
0.0095 |
0.007125 |
0.49 |
0.35 |
|
Field level (0.4 ha) |
11608.1 |
3160 |
2375 |
0.27 |
0.20 |
|
System level |
3099174 |
821000 |
954750 |
0.26 |
0.30 |
|
III. Well system |
|||||
|
Plant/ crop level |
|||||
|
Maize |
0.048 |
0.050 |
0.21 |
1.04 |
4.38 |
|
Banana |
6.6 |
8.5 |
59.70 |
1.28 |
8.99 |
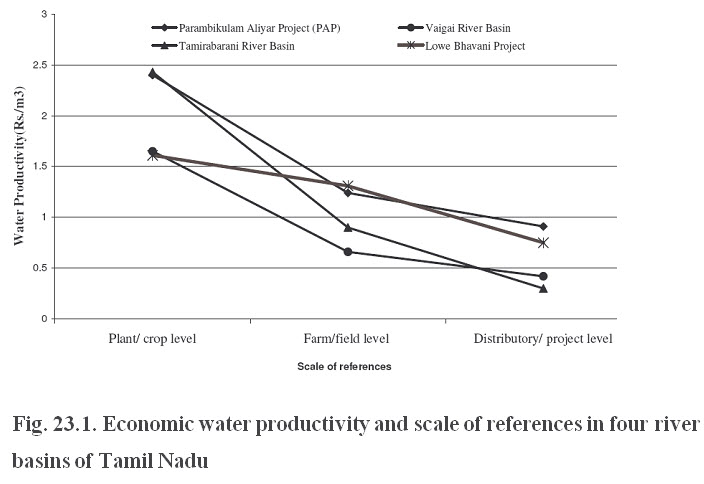
From the results, it is clearly understood that there was a considerable reduction in water productivity under field level (0.20 kg groundnut/ m3 of water in PAP, 0.40 kg rice / m3 in Lower Bhavani project (LBP), 0.24 kg rice / m3 in Vaigai and 0.27 kg rice / m3 in Tampiraparani river basin) as compared to individual plant/ crop level (0.39 kg groundnut/ m3 of water in PAP, 0.73 kg rice / m3 in LBP, 0.70 kg rice / m3 in Vaigai and 0.60 kg rice / m3 in Tampiraparani river basin) mainly due to losses through seepage, deep percolation and runoff in the canal irrigation systems. Among the four canal irrigation projects, Lower Bhavani project was recorded higher productivity at plant level (0.73 kg/ m3) as well as at farm level (0.40 kg/ m3) compared to other projects. At distributory level, conveyance losses caused reduction in water productivity which means that more quantity of water is being used for crop cultivation. So water productivity has a negative relationship with the scale of reference that is expansion of boundary of command area (Fig 23.1).
In the case of tank irrigation, Srivilliputhur Big tank in Ramanathapuram district of Tamil Nadu was taken for the study as the data on most of the parameters of water productivity calculations were available. The results showed that there was a reduction in water productivity when the scale of reference has increased. The physical water productivity of rice was higher under individual plant level (0.47 kg / m3) followed by field level water productivity (0.30 kg / m3) and comparatively lower water productivity was recorded under tank system level.
Similarly, the water productivity under well irrigation system was studied at farmers’ fields of Coimbatore district where well irrigation is being predominantly practiced. Maize and banana were the major crops considered to workout the water productivity. Well irrigation system is having different field crops as well as allied enterprises whereas other systems are having predominantly rice crop only except Parambikulam Aliyar Project (PAP), where groundnut is the major crop. So multiple water uses was studied in different farm enterprises at farmers’ holdings in working out the water productivity. Farms with crops alone, crop + dairy and crop + fishery were analysed in this study. The results showed that the farm, which is having allied enterprises along with crops registered higher water productivity over the farms with crops alone. Comparing the different combination of farm enterprises, crop + fishery system has resulted in higher water productivity (Rs.41.43/ m3) followed by crop + dairy combination (Rs.11.27/ m3) and the lower water productivity of Rs.9.64/ m3 was observed with crops alone. Details of calculations on multiple water use at farm level under well irrigation are given in Annexure II of
In short, among the different irrigation systems, well system has comparatively higher water productivity both in physical and economic terms due to controlled irrigation application, comparatively higher crop yields and multiple crops/ enterprises combinations. Whereas in canal and tank system, mono cropping, uncontrolled irrigations, and scarcity of water during critical crop periods result in lower water productivity.
23.2. Technical and Irrigation Efficiencies
The technical efficiency of farmers in terms of using improved technology for higher productivity in different irrigation systems viz., canal, tank and well irrigation systems and four river basin projects namely Lower Bhavani, Periyar Vaigai, Tamparaparani and Parambikulam Aliyar projects is present in Table 23.2. Farms irrigated with well water produced comparatively higher technical efficiency (77.30%), followed by canal system (71.44%) and tank system (70.3%). Farms of Lower Bhavani project had the highest average technical efficiency (74.56%) followed by farms in Periyar Vaigai, Tamparaparani and Parambikulam Aliyar projects. The average technical efficiency of all the farms in Tamparaparani project was 71.09%. This means that 26.91% increase in production is achievable with the present state of technology with no change in input levels if technical inefficiency is completely removed. Parambikulam Aliyar project farms had the least average technical efficiency of 67.69%. An analysis of the figures in Table 23.2 reveals that 69.65% of farms in well system and 56.79 farms in tank system were having more than 70% technical efficiency. In canal projects, 27.11 % farms in Parambikulam Aliyar project and about 30.9 % of the farms in Tamparaparani project produced the technical efficiency of above 80% thus indicating that there is much scope for increasing the usage of inputs in these projects compared to other projects. About 48.15 % of the farms in Periyar Vaigai and 46.55% farms in Lower Bhavani project were having 80% or more technical efficiency. In all the four projects, majority of farms comes under more than 70% technical efficiency and about 10% of farms in all the projects were having less than 50% technical efficiency indicating the scope for making interventions in improving the productivity.
Table 23.2. Frequency distribution of Technical Efficiency (TE) ratings of farms in different irrigation system
|
Projects |
Canal system |
Tank system |
Well system |
||||
|
Tampiraparani |
Periyar
Vaigai |
Parambikulam
Aliyar |
Lower
Bhavani |
||||
|
TE (%) |
|||||||
|
<20 |
0 |
0 |
0 |
1 |
0 |
0 |
|
|
20-30 |
1 |
0 |
2 |
1 |
1 |
1 |
|
|
30-40 |
1 |
0 |
2 |
1 |
3 |
1 |
|
|
40-50 |
4 |
7 |
3 |
2 |
6 |
2 |
|
|
50-60 |
5 |
6 |
11 |
3 |
15 |
3 |
|
|
60-70 |
13 |
8 |
10 |
7 |
10 |
7 |
|
|
70-80 |
14 |
7 |
15 |
16 |
19 |
6 |
|
|
80-90 |
15 |
22 |
16 |
20 |
15 |
12 |
|
|
90-100 |
2 |
4 |
0 |
7 |
12 |
14 |
|
|
N |
55 |
54 |
59 |
58 |
81 |
46 |
|
|
Mean |
71.09 |
72.4 |
67.69 |
74.56 |
70.3 |
77.30 |
|
|
Maximum |
93.08 |
92.13 |
89.86 |
95.8 |
99.4 |
98.58 |
|
|
Minimum |
26.95 |
40.50 |
29.25 |
13.8 |
23.2 |
25.70 |
|
Given the levels of technical efficiencies across four projects, it is important to examine how the irrigation efficiencies vary across them as irrigation is the key factor that will affect the technical efficiency. The irrigation efficiency frequencies are given in Table 23.3. It reveals that the average irrigation efficiency of the farms in all the four projects is 42.14 % indicating that retaining all other inputs at the current usage level, 57.86 % of the current level of irrigation water is sufficient to produce the current level of output while using 42.14 % less of irrigation water.
Table 23.3. Frequency distribution of Irrigation Efficiency (IE) ratings of farms in different irrigation systems
|
Projects |
Canal system |
Tank system |
Well system |
|||||
|
Tampiraparani |
Periyar
Vaigai |
Parambikulam
Aliyar |
Lower
Bhavani |
|||||
|
IE (%) |
||||||||
|
<20 |
11 |
8 |
5 |
5 |
10 |
4 |
||
|
20-30 |
10 |
9 |
12 |
5 |
15 |
1 |
||
|
30-40 |
11 |
9 |
17 |
9 |
17 |
3 |
||
|
40-50 |
9 |
13 |
10 |
15 |
8 |
2 |
||
|
50-60 |
7 |
6 |
5 |
5 |
8 |
6 |
||
|
60-70 |
3 |
5 |
4 |
11 |
6 |
5 |
||
|
70-80 |
4 |
2 |
3 |
4 |
6 |
8 |
||
|
80-90 |
0 |
2 |
3 |
3 |
3 |
5 |
||
|
90-100 |
0 |
0 |
0 |
1 |
8 |
12 |
||
|
N |
55 |
54 |
59 |
58 |
81 |
46 |
||
|
Mean |
38.47 |
41.30 |
40.98 |
47.82 |
46.0 |
66.35 |
||
|
Maximum |
78.13 |
84.20 |
83.74 |
93.26 |
99.0 |
98.73 |
||
|
Minimum |
2.98 |
10.88 |
8.04 |
4.65 |
1.2 |
0.00 |
||
|
|
||||||||
An analysis of irrigation efficiencies across the different irrigation systems, higher irrigation efficiency of 66.35% was noticed under well irrigation system, followed by tank system (46.0%) and canal system of irrigation. Among the four canal irrigation projects, Lower Bhavani project produced higher irrigation efficiency of 47.82% whereas Tamparaparani project showed the lowest efficiency of 38.47%. In well system, more than 90% irrigation efficiency was observed in 12 farms and in tank system it was 8 farms. Irrigation efficiency of more than 50% was observed in more number of farms in Lower Bhavani project (41.37%), followed by Periyar Vaigai (27.7%), Tamparaparani (25.45%) and Parambikulam Aliyar (25.42%). While analyzing the break-ups in irrigation efficiency, around 40-50% of irrigation efficiency was noticed in 13 out of 54 farms in Periyar Vaigai project. In Tamparaparani project, out of 55, 21 farms come under less than 30 % irrigation efficiency whereas in Lower Bhavani project only 10 farms out of 58 were shown less than 30% efficiency. The results thus indicate that in the canal irrigation systems, improving the irrigation efficiencies is important and which in turn will help achieve the increased technical efficiency.
Last modified: Thursday, 5 December 2013, 9:54 AM