Site pages
Current course
Participants
General
MODULE 1. Systems concept
MODULE 2. Requirements for linear programming prob...
MODULE 3. Mathematical formulation of Linear progr...
MODULE 5. Simplex method, degeneracy and duality i...
MODULE 6. Artificial Variable techniques- Big M Me...
MODULE 7.
MODULE 8.
MODULE 9. Cost analysis
MODULE 10. Transporatation problems
MODULE 11. Assignment problems
MODULE 12. waiting line problems
MODULE 13. Network Scheduling by PERT / CPM
MODULE 14. Resource Analysis in Network Scheduling
LESSON 1. Introduction to Models
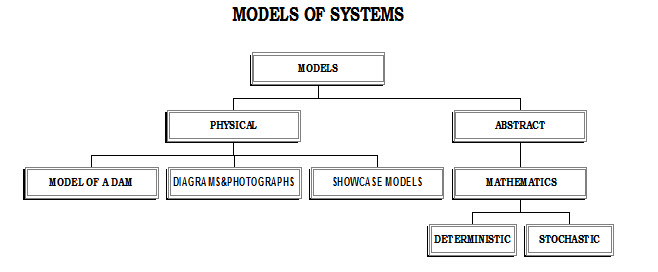
A system can be represented by means of a model. A representation of the system is called model. Models is broadly categorized into two types
- Physical model
- Abstract or mathematical model
Physical model:
Model of a dam, aircraft, table, graph, photograph, etc are called as physical model. showcase models etc
Mathematical or Abstract model:
If a system is represented by a set of equations, then it is called abstract or mathematical model.
Solution to the system:
The solution to the systems is obtained by solving the one or more equations. Any inference can be drawn about the system from the solution of the equations. Before drawing valid inferences, the validity of the model is to be tested.
Simulation:
Simulation is an art of creating a realistic situation of the system. Simulation can be defined as the art of building models and the study of their properties with reference to those of the systems they represent. Models can be classified into
Statistical models
Simulation models
1. Statistical models: If we develop an empirical relation between the variables ie Regression models without having any realistic assumption of the system, then it is called statistical or analytical models. These models can not be simulated or optimized. These are also useful, but there are some limitations.
2. Simulation models: If we make realistic assumption on the system and then we develop a suitable model based on the system, the resulting model is called as a simulation model. This can be used for drawing valid inferences on the system.
Types of models:
-
Exact model: In this model, the different components will be exhibited as it is. E.g. Farm management exhibition, exhibiting crops or animals as it is.
-
Analog model: Representing one for the other is called analog model. In this case, the specimens can not be exhibited as it is. Instead, some samples will be exhibited.
-
Stochastic model: The model which gives the chance of occurrence of the parameters of the model is called as stochastic model. In stochastic models, it is also assumed to vary with time. But, in deterministic models, which determine the exact values, i.e. the parameter is assumed to be a constant for a shorter period.
-
Static model: The model for a point of time or for a shorter period is called static model. static models contain the relation between crop yield and factors of yield,crop growth and respiration .Such static models also regarded as a component of dynamic models.
-
Dynamic model: grows along with time. i.e. keeps on changing from one value to another.That is the dynamic models changes in time where as static models represent the relations between the variables which do not involve time.
Testing Validity of Crop Models:
As soon as a model is constructed, the validity of the model is to be tested before drawing any inferences or simulating the model. If the model is developed which suits the present set of observations, then only the inferences can be drawn. Before drawing any inference from estimated model, one should be careful with the location, season and assumptions of construction of model. Keeping all these limitations, if the present experiment exist in the similar situation then the inference can be drawn. For example, in the multiple linear regression model Y=a0+a1N+a2P+a3K+…, we cannot optimize the nutrient levels, because the assumption in this model is that crop yield increases with increase in the nutrient levels. But in reality, this holds good only upto the optimum level, beyond which the will yield decrease.
One must also examine the sign and size of the co-efficient in the models. For example, consider the response model Y= 1200 + 3 N-0.03 N2. Normally for any response model, sign of the square term must be negative. Similarly, the size of the co-efficient will be small for annual crops. It will not be very high value. If so, we will have to examine the model.
We have to test the estimated co-efficient of r or R2 for its significance. We can use to test the validity model for chi-square goodness of fit ,
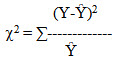
Where Y is the observed value and Ŷ is the predicted value.
It follows the chi-square distribution with n-1 degrees of freedom. If the calculated chi-square value is less than the table value then the test is non-significant. i.e. the observed values are in line with the expected values. It can be inferred that the model is good. If the calculated chi-square value is more than the table value then test is significant. i.e. the observed values are significantly different from the expected values. It can be concluded that the models does not fit for the data.
Simulation Techniques for Measuring Leaf Area:
Leaf area refers to the area of leaf (photosynthetic area) expressed in sq. cm. plant-1. Leaf area can be accurately measured using leaf area meter of various models. In the absence of leaf area meter, the leaf area can be measured using simulation models. Before drawing any inferences, the models should be evaluated for their validity.
Development of the model:
-
Take a graph sheet and mark X and Y-axes.
-
Keep the leaf, whose area is to be measured, on the XY quadrate and mark through the edges of the leaf.
-
Remove the leaf.
-
Draw a rectangle inscribing the leaf area. Let l and b be the length and breadth of rectangle, respectively.
-
Using the random numbers, mark points in XY quadrate.
-
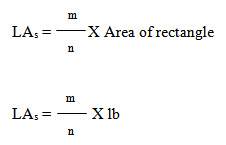
Let m be the total number of points inside the leaf area and n be the total number of points in the rectangle. Leave the points outside the rectangle.
-
The leaf area by simulation is
Evaluation of the model:
Let LAm be the leaf area estimated be leaf area meter. Then the error is calculated as Error = LAm - LAs
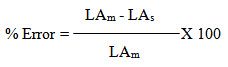
The percentage error should be lower for accepting the model. The error will be lower if we consider more number of points.
Crop Growth Models:
Normally growth models are crop growth as a function of time. We know that crop growth is influenced by Various factors like seed type, climate, soil, fertilizer application, time, etc. To avoid the complexity in growth model, we consider that crop growth is a function of time alone and maintain all other factors at same level. i.e. the small variation in other growth factors are assumed to be negligible. Therefore, the growth model is in the form of
W = f (t)
Where W = dry matter production in g plant-1
t = time in days
In growth models, for annual crops the growth is measured in g plant-1 and time is measured in days.
Data construction for growth models:
As soon as we collect the observation for model building, we have to go through the data very carefully and identify extremities in observation. Mark these extreme observations and find out the reason for the extremities. If the reason is not proper, we have to remove the extremities form the set of observations. For construction of growth model, we have to measure the DMP in g plant-1 only and the growth period is measured in days for annual crops.
The observations should be collected throughout the period or complete period of study. For example, if wee want to construct a crop growth model, the observation should be collected throughout the crop growth. Similarly for response functions, observations should be collected beyond the optimum level. The observation should be collected in the equal period. No replication is needed for model construction. The observation must be distributed throughout the period of study. More number of observation will increase the precision in the model construction. The data should not be crowded during one period and thin in other periods. The precision must be maintained in data collection. The size of observation should be taken care of. Suppose, we collect observation at a time on a day, we have to maintain the time of observation throughout the study.
Last modified: Thursday, 27 March 2014, 9:15 AM