Site pages
Current course
Participants
General
MODULE 1. Systems concept
MODULE 2. Requirements for linear programming prob...
MODULE 3. Mathematical formulation of Linear progr...
MODULE 5. Simplex method, degeneracy and duality i...
MODULE 6. Artificial Variable techniques- Big M Me...
MODULE 7.
MODULE 8.
MODULE 9. Cost analysis
MODULE 10. Transporatation problems
MODULE 11. Assignment problems
MODULE 12. waiting line problems
MODULE 13. Network Scheduling by PERT / CPM
MODULE 14. Resource Analysis in Network Scheduling
LESSON 3. Time cost Optimization- Problems
Examples
The following table gives data on normal time, and cost and crash time and cost for a project.
|
Activity |
Normal |
Crash |
||
|
Time (Weeks) |
Cost (Rs) |
Time (Weeks) |
Cost (Rs) |
|
|
1-2 |
3 |
300 |
2 |
400 |
|
2-3 |
3 |
30 |
3 |
30 |
|
2-4 |
7 |
420 |
5 |
580 |
|
2-5 |
9 |
720 |
7 |
810 |
|
3-5 |
5 |
250 |
4 |
300 |
|
4-5 |
0 |
0 |
0 |
0 |
|
5-6 |
6 |
320 |
4 |
410 |
|
6-7 |
4 |
400 |
3 |
470 |
|
6-8 |
13 |
780 |
10 |
900 |
|
7-8 |
10 |
1000 |
9 |
1200 |
Indirect cost is Rs 50 per week
(a) Draw the network and identify the critical path with double line.
(b) What are the normal project duration and associated cost?
(c) Find out the total float associated with each activity.
(d) Crash the relevant activities systematically and determine the optimal project completion time and cost
Solution:
(a) The network for normal activity times indicates a project completion time of 32 weeks with the critical path: 1 – 2 – 5 – 6 – 7 – 8, as shown in Fig. 24.
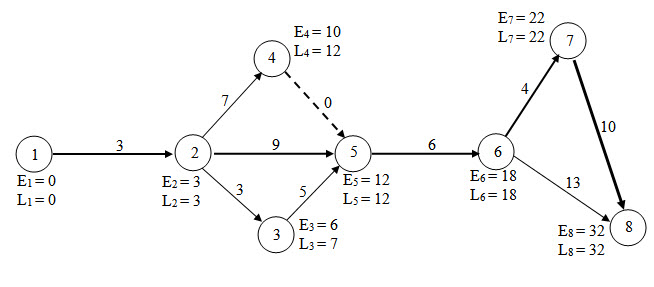
Fig. 24 Network Diagram
(b) Normal project duration is 32 weeks and the associated cost is as follows:
Total cost = Direct normal cost + Indirect cost for 32 weeks
= 4,220 + 50 x 32 = Rs 5,820
(c) Calculations for total float associated with each activity are shown in Table 10
Table 10
|
Activity |
Total Float (Li – Ei) – tij |
|
1 - 2 |
(3 – 0) – 3 = 0 |
|
2 – 3 |
(7 – 3) – 7 = 1 |
|
2 – 4 |
(12 – 3) – 7 = 2 |
|
2 – 5 |
(12 – 3) – 9 = 0 |
|
3 – 5 |
(12 – 6) – 5 = 1 |
|
4 – 5 |
(12 – 10) – 0 = 2 |
|
5 – 6 |
(18 – 12) – 6 = 0 |
|
6 – 7 |
(22 – 18) – 4 = 0 |
|
6 – 8 |
(32 – 18) – 13 = 1 |
|
7 – 8 |
(32 – 22) – 10 = 0 |
(d) For Critical activities, crash cost-slope is given in Table 11. The minimum value of crash cost per week is for activity 2-5 and 5-6. Hence, Crashing activity 2-5 by 2 days from 9 weeks to 7 weeks. But the time should be reduced by 1 week only otherwise another path 1-2-3-5-6-7-8 becomes a paralled path. Network as shown Fig. 25 is developed when it is observed that new project time is 31 weeks and the critical paths are 1 – 2 – 5 – 6 – 7 – 8 and 1 – 2 – 3 – 5 – 6 – 7 – 8.
Table 11
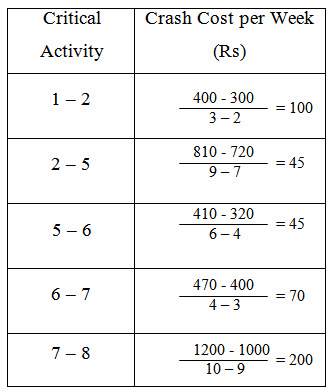
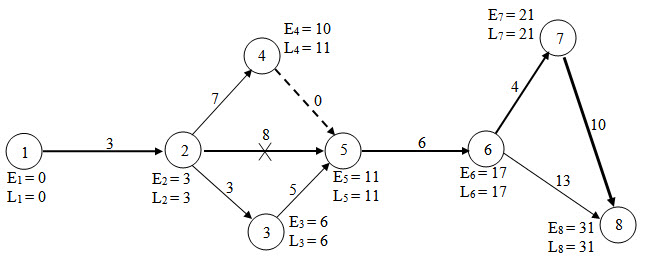
Fig. 25 Network Diagram
With crashing of activity 2 – 5, the new total cost involved can be calculated as follows:
New total cost = Total direct normal + Increased direct cost due to crashing of activity
(2 – 5 ) + indirect cost for 31 weeks
= (4,220 + 1 x 45) + 31 x 50 = 4,265 + 1,550 = Rs 5,815
Now with respect to network given in Fig. 25, the new possibilities for crashing in the critical paths are listed in Table 12.
Table 12
|
Critical Activity |
Crashed Cost per Week (Rs) |
|
1 – 2 |
100 |
|
2 – 5 |
x (Crashed) |
|
2 – 3 |
0 (No crashing is needed) |
|
3 – 5 |
50 |
|
5 – 6 |
45 |
|
6 – 7 |
70 |
|
7 – 8 |
200 |
The minimum value of crashed cost slope is for activity 5 – 6. Hence, crashing it by 2 weeks from 6 weeks to 4 weeks. The new network diagram will now look like as show in Fig. 26
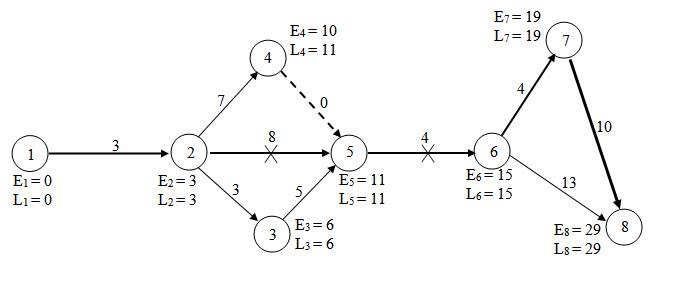
Fig. 26 Network Diagram
It may be noted in Fig.26, that both critical paths shown in Fig.25 remain unchanged because activity 5 – 6 is common between critical paths shown in Fig. 25. But with this crashing of activity 5 – 6 by 2 weeks, the new cost involved is:
New total cost = Total direct normal + Increased direct cost due to crashing of
5 – 6 + indirect cost for 29 weeks
= (4,220 + 1 x 45 + 2 x 45) = 29 x 50 = Rs 5805
With respect to network given in Fig 26, the new possibilities for crashing in the critical paths are listed in Table 13.
Table 13
|
Critical Activity |
Crashed Cost per Week (Rs) |
|
1 – 2 |
100 |
|
2 – 3 |
0 (No crashing is needed |
|
2 – 5 |
x (Crashed)) |
|
5 – 6 |
x (Crashed) |
|
6 – 7 |
70 |
|
7 – 8 |
200 |
The further crashing of 6 – 7 activity time from 4 weeks to 3 weeks will result in increased direct cost than the gain due to reduction in project time. Hence, here we must stop further crashing. The optimal project duration is 29 weeks with associated cost of Rs 5,805 as shown in Table 14.
Table 14 Crashing Schedule of the Project
|
Project Duration (Weeks) |
Crashing Activity and Weeks |
Direct Cost (Rs) |
Indirect cost (Rs) |
Total Cost (Rs) |
||
|
Normal |
Crashing |
Total |
||||
|
32 |
-- |
4,220 |
-- |
4,220 |
32 x 50 = 1,600 |
5,820 |
|
31 |
2 – 5(1) |
4,220 |
1 x 45 = 45 |
4,265 |
31 x 50 = 1,550 |
5,815 |
|
29 |
5 – 6(2) |
4,220 |
45 + 2 x 45 = 135 |
4,355 |
29 x 50 = 1,450 |
5,805 |
|
28 |
6 – 7(1) |
4,220 |
135 + 1 x 70 = 205 |
4,425 |
28 x 50 = 1,400 |
5,825 |
Last modified: Thursday, 27 March 2014, 9:25 AM