Site pages
Current course
Participants
General
Module- 1 Engineering Properties of Biological Mat...
Module- 2 Physical Properties of Biomaterials
Module- 3 Engineering Properties
Module- 4 Rheological Properties of Biomaterials
Module- 5 Food Quality
Module- 6 Food Sampling
Module- 7 Sensory quality
Module 8. Quality Control and Management
Module 9. Food Laws
Module 10. Standards and regulations in food quali...
Lesson 32. Sanitation in food industry
Lesson 24. Interpretation of Sensory Results And Statistical Analysis
24.0 Introduction:
Statistical quality control (SQC) is the term used to describe the set of statistical tools used by quality professionals. SQC employs statistical principles and methods which have been developed to assess the magnitude of chance cause variation and to detect assignable cause variation. It indicates the limits beyond which these variations in the product should not go without correction.
SQC encompasses three broad categories :
Descriptive statistics (e.g.the mean, standard deviation, and range)
Statistical process control(SPC)
Quality characteristics are measured and charted
helpful in identifying in-process variations
- Acceptance sampling used to randomly inspect a batch of goods to determine acceptance/rejection Does not help to catch in-process problems
Sources of Variation:
Variation exists in all processes. Variation can be categorized as :
Common or random causes of variation, or Random causes that
we cannot identify,
unavoidable,
Eg. Slight difference in process variables lie diameter, weight, service time, temperature
assignable causes of variation:
causes can be identified and eliminated,
eg poor employee training, worn tool, machine needing repair
24.1 Traditional statistical tool:
24.1.1. Descriptive statistics include
The mean: measure of central tendency
\[\bar X=\frac{{\sum\nolimits_{i=1}^n{X_i}}}{n}\]
The range: difference between largest/ smallest observations in a set of data.
Standard deviation: measures the amount of data dispersion around mean.
\[\sigma=\sqrt{\frac{{\sum\nolimits_{i=1}^n{{\left({{X_i}-\bar X}\right)}^2}}}{{n-1}}}\]
Distribution of data shape
Normal or bell shape
Skewed
24.1.2. Distribution of Data
24.2 Statistical Process Control (SPC)
A method of inspection by which it can be determined whether a process is in control
Differs from Acceptance Sampling in that SPC does not make judgements about the quality of the item processed.
Key tool is the Control Chart of which several types exist.
24.2.1 SPC Defined
All processes are affected by multiple factors and, therefore, SPC can be applied to any process.
There is inherent variation in any process which can be measured and “controlled.”
SPC does not eliminate variation, but it does allow the user to track special cause variation.
“SPC is a statistical method of separating variation resulting from special causes from natural variation and to establish and maintain consistency in the process, enabling process improvement”.
24.2.2The Seven Tools of Quality
-
Control chart
-
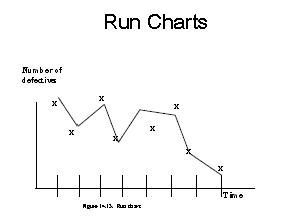
Run chart
-
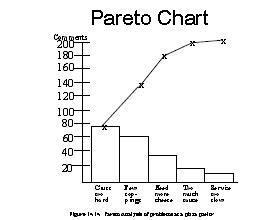
Pareto chart
-
Flow chart
-
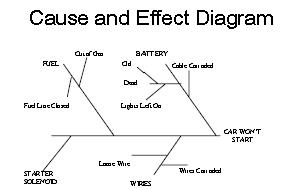
Cause and effect diagram
-
Histogram

-
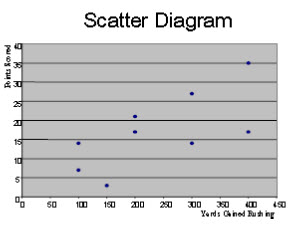
Scatter diagram
24.2.3 Variation in Processes
-
Common Cause variation - the variation which in inherent in the process itself; when sampled, a normal distribution is found; a process is said to be in statistical control when only common cause variation exists.
-
Special (or Assignable) Cause variation – the variation in process output that might be traced to a specific cause; the process is said to be out of control when a special cause variation exists.
24.2.4 Rationale for SPC
-
Control of Variation
-
Continuous Improvement
-
Predictability of Processes
-
Elimination of Waste
-
Product Inspection
24.2.5. SPC Methods-Control Charts
-
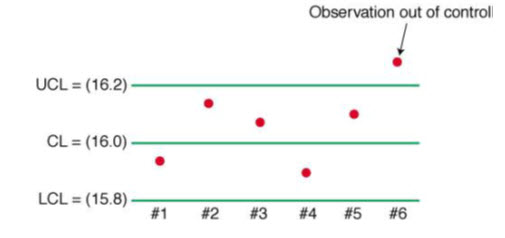
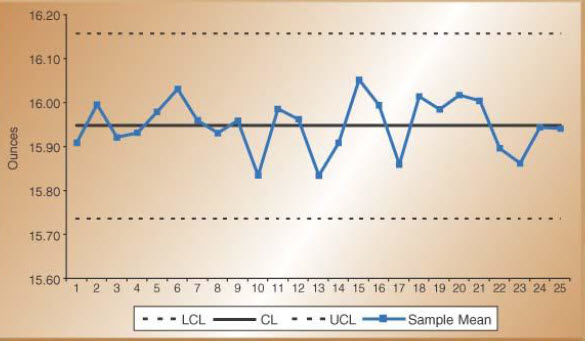
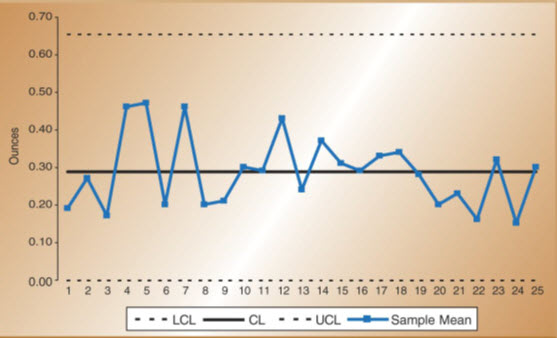
Control Charts show sample data plotted on a graph with CL, UCL, and LCL
-
Control chart for variables are used to monitor characteristics that can be measured, e.g. length, weight, diameter, time
-
Control charts for attributes are used to monitor characteristics that have discrete values and can be counted, e.g. % defective, number of flaws in a shirt, number of broken eggs in a box11
24.2.6 Creating Control Charts
-
All control charts rely on the periodic sampling and measurement of items.
-
The data collected will allow the calculation of a centerline, and upper and lower control limits.
-
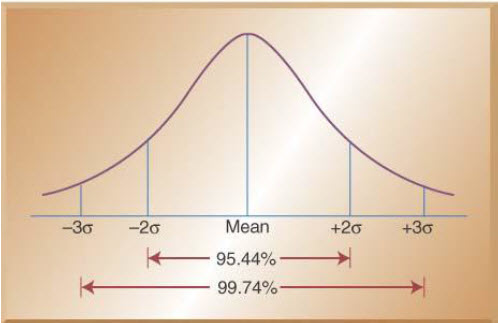
The centerline is the mean of all samples, whereas the control limits are, conceptually, the mean +/- three standard deviations.
Interpreting Control Charts
SPC is based upon the Central Limit Theorem which tells us, in effect, that the samples will follow a normal distribution regardless of the shape of the parent distribution.
Interpreting control charts is, then, all about probabilities – if the observations aren’t probable, then there must be a special cause variation.
24.2.7. Setting Control Limits
Percentage of values under normal curve
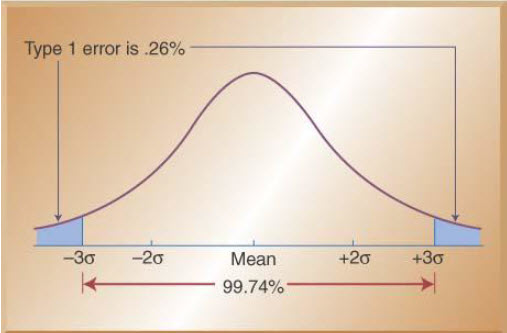
Control limits balance risks like Type I error
Control Charts for Variables
-
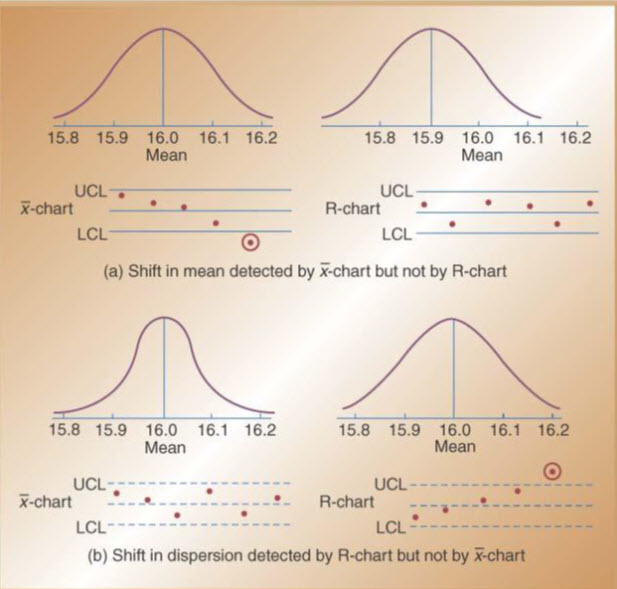
Use x-bar and R-bar charts together
-
Used to monitor different variables
-
X-bar& R-bar Charts reveal different problems
-
In statistical control on one chart, out of control on the other chart? OK?
-
Use x-bar charts to monitor the changes in the mean of a process (central tendencies)
-
Use R-bar charts to monitor the dispersion or variability of the process
-
System can show acceptable central tendencies but unacceptable variability
-
System can show acceptable variability but unacceptable central tendencies
X-Bar Control Chart
R-Bar Control Chart
Control Charts for Attributes –P-Charts & C-Charts
Attributes are discrete events; yes/no, pass/fail
-
Use P-Charts for quality characteristics that are discrete and involve yes/no or good/bad decisions
-
Number of leaking caulking tubes in a box of 48
-
Number of broken eggs in a carton
-
Use C-Charts for discrete defects when there can be more than one defect per unit
-
Number of flaws or stains in a carpet sample cut from a production run
-
Number of complaints per customer at a hotel
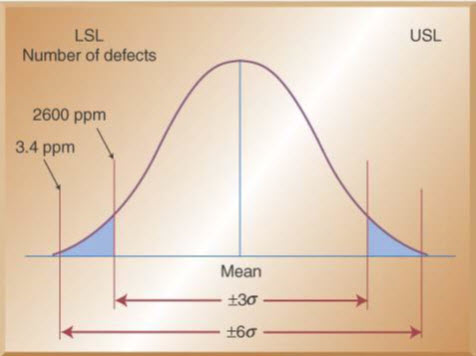
±6 Sigma versus ±3 Sigma
Motorola coined “six-sigma”to describe their higher quality efforts back in 1980’s.
PPM Defective for ±3σ versus ±6σ quality.
-
Six-sigma quality standard is now a benchmark in many industries
-
Before design, marketing ensures customer product characteristics
-
Operations ensures that product design characteristics can be met by controlling materials and processes to 6σlevels
-
Other functions like finance and accounting use 6σconcepts to control all of their processes
Special Cause Variation is assumed to exist if:
1. Any point falls outside the control limits.
2. Nine consecutive observations fall on one side of the mean.
3. Six consecutive observations are increasing (or decreasing.)
4. 14 observations alternate above and below the mean.
5. Two of three consecutive points fall in zone C in one-half of the chart.
6. Four of five consecutive points fall in zone B in one-half of the chart.
Risks of SPC
-
SPC has the same Type I and Type II risks as acceptance sampling
-
If the process if in fact in control but we conclude that it is out of control, we have committed a Type I error.
-
If the process if in fact out of control but we conclude that it is in control, we have committed a Type II error.
Common control charts for variables and attributes
Data category
Chart type
Statistical quality
Variables data
X-bar and R
Mean and range
X-tilde and
Median and range
X-Rs
Individual data
Attributes data
P- chart
Percent defects
Np -chart
Number of defectives
c-chart
Number of defects
u-chart
Number of defects per unit (length, area, time etc.)
What SPC does not do
-
SPC only determines whether a process is in statistical control NOT whether the process is producing within specifications nor whether the process is even capable of producing within specifications.
-
We must rely on another measure AFTER we have assured that the process is in control using SPC.
-
24.3 Acceptance Sampling
Definition: The third branch of SQC refers to the process of randomly inspecting a certain number of items from a lot or batch in order to decide whether to accept or reject the entire batch.
Different from SPC because acceptance sampling is performed either before or after the process rather than during
Sampling before typically is done to supplier material
Sampling after involves sampling finished items before shipment or finished components prior to assembly
Used where inspection is expensive, volume is high, or inspection is destructive