Site pages
Current course
Participants
General
Module.1 Introduction of Water Resources and Hydro...
Module.2 Precipitation
Module.3 Hydrological Abstractions
Moule.4 Types and Geomorphology of Watersheds
Module 5. Runoff
Module 6. Hydrograph
Module 7. Flood Routing
Module 8. rought and Flood Management
19 April - 25 April
26 April - 2 May
Lesson 22 Stream Flow Hydrograph
22.1 Definition of Hydrograph
The hydrograph which results due to an isolated storm is typically singlepeaked skew distribution of discharge and is known variously as storm hydrograph, flood hydrograph or simply hydrograph.
The hydrograph is the response of a given catchment to a rainfall input. It consists of flow in all the three phases of runoff, viz. surface runoff, interflow and base flow and embodies in itself the integrated effects of a wide variety of catchment and rainfall parameters having complex interactions.
22.2 Elements of Hydrograph
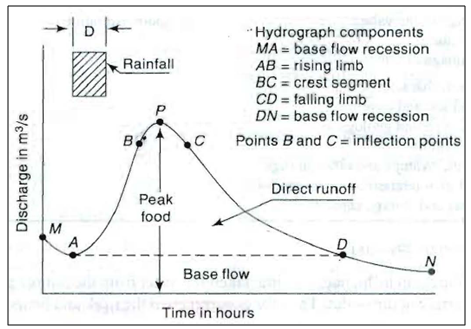
Hydrograph has three characteristic regions: (i) the rising limb AB, joining point A, the starting point of the rising curve and point B, the point of inflection, (ii) the crest segment BC between the two points of inflection with a peak P in between, (iii) the falling limb or depletion curve CD starting from the second point of inflection C (Fig. 22.1).

Fig. 22.1.Elements of a hydrograph. (Source: Subramanya, 2008)
22.2.1 Rising Limb
The rising limb f a hydrograph, also known as concentration curve represents the increase in discharge due to the gradual building up of storage in channel and over the catchment surface. The initial losses and high infiltration losses during the early period of a storm cause the discharge to rise rather slowly in the initial periods. The basin and storm characteristics control the shape of the rising limb of a hydrograph.
22.2.2 Crest Segment
The crest segment is one of the most important parts of hydrograph as it contains the peak flow. The peak now occurs when the runoff from various parts of the catchment simultaneously contribute amounts to achieve the maximum amount of flow at the basin outlet. Generally for large catchments, the peakflow occurs after the cessation of rainfall, the time interval from the centre of mass of rainfall to the peak being essentially controlled by basin and storm characteristics. Multiple-peaked complex hydrographs in a basin can occur when two or more storms occur in succession. Estimation of the peak flow and its occurrence, being important in flood-flow studies are dealt with in detail elsewhere in this book.
22.2.3 Recession Limb
The recession limb, which extends from the point of inflection at the end of the crest segment (point C in Fig. 22.1) to the commencement of the natural groundwater flow (point D in Fig. 22.1) represents the withdrawal of water from the storage built up in the basin during the earlier phase of the hydrograph. The starting point of the recession limb, i.e. the point of inflection represents the condition of maximum storage. Since the depletion of storage takes place after the cessation of rainfall, the shape of this part of the hydrograph is independent of storm characteristics and depends entirely on the basin characteristics.
StreamflowRecession
The storage of water in the basin exists as (i) surface storage, which includes both surface detention and channel storage, (ii) interflow storage, and (iii) groundwater storage, i.e. base-flow storage.
Barnes (1940) showed that the recession of a storage can be expressed as
 (22.1)
WhereQ is the discharge at a time t and Q0is the discharge at t= 0; Kris a recession constant of value less than unity.
Equation 22.1 can also be expressed in an alternative form of the exponential decay as
 (22.1a)
Where a = -lnKr
Example 1
On June 1, 1980 the discharge in a stream was measured as 80 m3/s. Another measurement on June 21, 1980 yielded the stream discharge as 40 m3/s. There was no rainfall in the catchment from April 15, 1980. Estimate the recession coefficient.
Answer:
Given = 40 m3/s, = 80 m3/s, t = 21-1 = 20
From Eq. 22.1

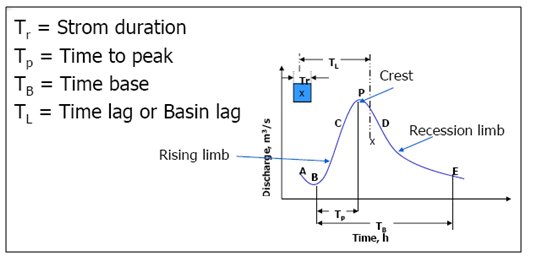
The time characteristics of hydrograph (Fig. 22.2) are described below:
Time Base of Hydrograph (TB)
It is the time from the beginning to the end of the direct runoff.
Lag Time (TL)
It is the difference in time between the center of mass of net rainfall and center of mass runoff.
Time to Peak (TP)
It is the time difference between the beginnings of direct runoff (point B in Fig. 22.2) to peak.
Rainfall Duration (Tr)
It is the effective rainfall duration, which causes direct runoff. Curve between point M and A represents recession from previous storm.

Fig. 22.2.Hydrograph time characteristics. (Source:Subramanya, 2008)
22.3 Factors Affecting Hydrograph

References
Subramanya, K. (2008). Engineering Hydrology,Third Edition, Tata McGraw Hill, 195-196.
Suggested Reading
Singh, V. P. (1994). Elementary Hydrology.Prentice Hall of India Private Limited,New Delhi.
Murty, V.V.N. and Jha, M.K. (2009).Land and Water Management Engineering.Fifth edition, Kalyani Publishers, Ludhiana.
Suresh R. (2007). Soil and Water Conservation Engineering.Fourth edition, Standard Publishers Distributors, New Delhi.