Site pages
Current course
Participants
General
Module.1 Introduction of Water Resources and Hydro...
Module.2 Precipitation
Module.3 Hydrological Abstractions
Moule.4 Types and Geomorphology of Watersheds
Module 5. Runoff
Module 6. Hydrograph
Module 7. Flood Routing
Module 8. rought and Flood Management
19 April - 25 April
26 April - 2 May
Lesson 28 Other Unit Hydrographs
28.1 Distribution Graph
The distribution graph introduced by Bernard (1935) is a variation of the unit hydrograph. It is basically D-h unit hydro graph with ordinates showing the percentage of the surface runoff occurring in successive periods of equal percentile intervals ofD-h. The duration of the rainfall excess (D-h) is taken as the unit interval and distribution-graph ordinates are indicated at successive such unit intervals. Note the ordinates plotted at D-h intervals and the total area under the distribution graph adds up to 100%. Distribution graphs are useful in comparing the runoff characteristics of different catchments.
Example 1
The 4-h, distribution graph of catchment of 50 km2 area has the following ordinates:
|
Unit periods (4-h units) |
1 |
2 |
3 |
4 |
5 |
6 |
|
Distribution (percentage) |
5 |
20 |
40 |
20 |
10 |
5 |
If the catchment has rainfall of 3.5, 2.2, and 1.8 cm in three consecutive 4-h periods, determine the resulting direct runoff hydrograph by assuming the index for the storm as 0.25 cm/h.
|
C1 |
C2 |
C3 |
C4 = C3*4 |
C5 = C2 – C4 |
C6 |
C7 = C6/100 |
C8 = 2.5*C7; 1.2*C7 (lagged by 4h); 0.8*C7 (lagged by 8 h) |
C9 = Summation of C8 |
|||
|
Time interval |
Rainfall |
Infiltration loss |
Infiltration loss |
Effective rainfall |
Avg distribution ratio |
Avg distribution ratio |
Distributed runoff for rainfall excess of |
Runoff |
|||
|
h |
cm |
cm/h |
cm |
cm |
(percentage) |
(decimal) |
2.5 cm |
1.2 cm |
0.8 cm |
cm |
m3/s |
|
0-4 h |
3.5 |
0.25 |
1 |
2.5 |
5 |
0.05 |
0.125 |
0.125 |
4.3 |
||
|
4-8 h |
2.2 |
0.25 |
1 |
1.2 |
20 |
0.2 |
0.5 |
0.06 |
0.56 |
19.4 |
|
|
8-12 h |
1.8 |
0.25 |
1 |
0.8 |
40 |
0.4 |
1 |
0.24 |
0.04 |
1.28 |
44.4 |
|
12-16 h |
20 |
0.2 |
0.5 |
0.48 |
0.16 |
1.14 |
39.6 |
||||
|
16-20 h |
10 |
0.1 |
0.25 |
0.24 |
0.32 |
0.81 |
28.1 |
||||
|
20-24 h |
5 |
0.05 |
0.125 |
0.12 |
0.16 |
0.405 |
14.1 |
||||
|
24-28 h |
0.06 |
0.08 |
0.14 |
4.9 |
|||||||
|
28-32 h |
0.04 |
0.04 |
1.4 |
||||||||
Answer
28.2 Dimensionless Unit Hydrograph
Dimensionless unit hydrographs based on a study of a large number of unit hydrographs. They are also used to facilitate construction of synthetic unit hydrographs. A typical dimensionless unit hydrograph contains ordinate (Q/Qp) which is the discharge Q expressed as a ratio to the peak discharge Qpand the abscissa (t/Tp), which is the time I expressed as a ratio of the time to peak Tp. By definition, Q/Qp= 1.0 when t/Tp= 1.0.
28.3 Instantaneous Unit Hydrograph
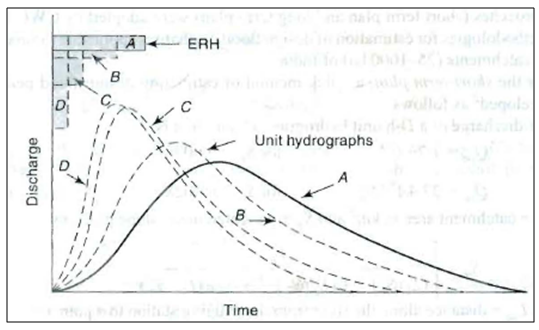
Fig 28.1 shows a typical variation of the shape of unit hydrographs for different values of D. As D is reduced, the intensity of rainfall excess being equal to 1/D increases and the unit hydrograph becomes more skewed. A finite unit hydrograph is indicated as the duration D → 0. The limiting case of a unit hydrograph of zero duration is known as instantaneous unit hydrograph(IUH).

Fig. 28.1.Unit hydrograph of different durations. (Source:Subramanya, 2008)
IUH is a fictitious, conceptual unit hydrograph which represents the surface runoff from the catchment due to an instantaneous precipitation of the rainfall excess volume of 1 cm.
IUH is designated as u (t)or sometimes as u(0, t). It is a single-peaked hydrograph with a finite base width and its important properties can be listed as below:
- 0 ≤ u (t) ≤ a positive value, for t ˃ 0;
- u (t) = 0 for t ≤ 0;
- u (t) → = 0 as t → ∞;
- = unit depth over the catchment; and
- Time to the peak time to the centroid of the curve.
The main advantage of IUH is that it is independent of the duration of ERH and thus has one parameter less than a D-h unit hydrograph. This fact and the definition of IUH make it eminently suitable for theoretical analysis of rainfall excess-runoff relationship of a catchment. For a given catchment IUH, being independent of rainfall characteristics, is indicative of the catchment storage characteristics.
References
Subramanya, K. (2008). Engineering Hydrology.Third edition, Tata McGraw Hill, 224-237.
Suggested Reading
Singh, V. P. (1994). Elementary Hydrology.Prentice Hall of India Private Limited,New Delhi.
Suresh R. (2007). Soil and Water Conservation Engineering.Fourth edition, Standard Publishers Distributors, New Delhi.
Murty, V.V.N. and Jha, M.K. (2009).Land and Water Management Engineering.Fifth edition, Kalyani Publishers, Ludhiana.