Site pages
Current course
Participants
General
Module.1 Introduction of Water Resources and Hydro...
Module.2 Precipitation
Module.3 Hydrological Abstractions
Moule.4 Types and Geomorphology of Watersheds
Module 5. Runoff
Module 6. Hydrograph
Module 7. Flood Routing
Module 8. rought and Flood Management
19 April - 25 April
26 April - 2 May
Lesson 27 Synthetic Unit Hydrograph
27.1 Definition and Uses of Synthetic Unit Hydrograph
To develop unit hydro graphs to a catchment, detailed information about the rainfall and the resulting flood hydrograph are needed. However, such information would be available only at a few locations and in a majority of catchments, especially those which are at remote locations; the data would normally be very scanty. In order to construct unit hydrographs for such areas, empirical equations of regional validity which relate the salient hydrograph characteristics to the basin characteristics are available. Unit hydrographs derived from such relationships are known as .synthetic-unit hydrographs.
These methods being based on empirical correlations are applicable only to the specific regions in which they were developed and should not be considered as general relationships for use in all regions.
27.2 Snyder’s Method
Snyder (1938), based on a study of a large number of catchments in the Appalachian Highlands of eastern United States developed a set of empirical equations for synthetic-unit hydrographs in those areas.
These equations are in use in the USA, and with some modifications in many other countries, and constitute what is known as Snyder’s synthetic-unit hydrograph.The most important characteristic of a basin affecting a hydrograph due to a storm is basin lag. Basin lag (also known as lag time) is the time difference between the centroid of the input (rainfall excess) and the output (direct runoff hydrograph). However, difficulty in determining the centroid of the direct runoff hydrograph (DRH), lag time is defined for practical purposes as the elapsed time between the centroid of rainfall excess and peak of DRH. Physically, lag time represents the mean time of travel of water from all parts of the watershed to the outlet during a given storm. Its value is determined essentially on the topographical features, such as the size, shape, stream density, length of main stream, slope, land use and land cover. The modified definition of basin time is very commonly adopted in the derivation of synthetic unit hydrographs for a given watershed.
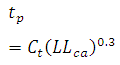
The first of the Snyder’s equation relate the basin lag tp,defined as the time interval from the mid-point of rainfall excess to the peak of the unit hydrograph (Fig. 27.1) to the basin characteristics as
 (27.1)
where tp is basin lag in hours, L is basin length measured along the water course from the basin divide to the gauging station in km, Lca distance along the main water course from the gauging station to a point opposite to the watershed centroid in km, Ct is a regional constant representing watershed slope and storage effects (1.3 to 1.65).
Snyder adopted a standard duration trhours of effective rainfall given by
 (27.2)
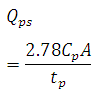
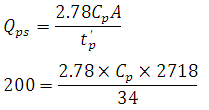
The peak discharge Qps(m3/s)of a unit hydrograph of Standard duration trh is given by Snyder as
 (27.3)
WhereA is catchment area km2, Cp is a regional constant (0.56-0.69).
This equation is based on the assumption that the peak discharge is proportional to the average discharge of ![]()
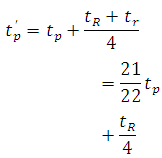
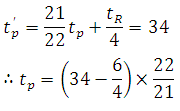
Lf a non-standard rainfall duration tRh is adopted, instead of the standard value trto derive a unit hydrograph the value of the basin lag is affected. The modified basin lag is given by
 (27.4)
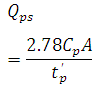
Where= basin lag in hours for an effective duration oftRhand tpis as given by Eq. (27.1).The value of must be used instead of tpin Eq. (27.2). Thus the peak discharge for a nonstandard ER of duration tRis in m3/s.
 (27.3a)
When tR = tr
Qp = Qps
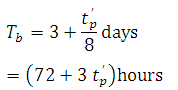
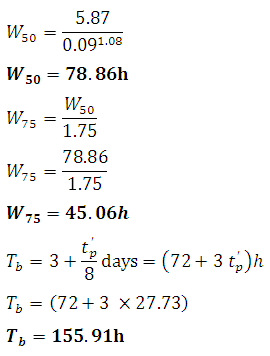
The time base of a unit hydrograph (Fig. 27.1) is given by Snyder as
 (27.5)
Withtb(given in h) taken as the next larger integer value divisible by tR, i.e. Tbis about five times the time-to-peak.
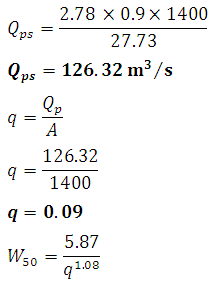
To assist in the sketching the unit hydrographs, the widths of unit hydrographs at 50 and 75% of the peak are given by
 (27.6)
 (27.7)
WhereW50 is width of UH in h at 50% peak discharge, W75 is width of UH in h at 75% peak discharge
q = Qp/A = peak discharge per unit catchment area in m3/s/km2
Example 1
Characteristics of two catchments M and N measured from a map are given below:
|
Item |
Catchment M |
Catchment N |
|
Lca |
76 km |
52 km |
|
L |
148 km |
106 km |
|
A |
2718 km2 |
1400 km2 |
For the 6-h unit hydrograph in catchment M, the peak discharge is at 200 m3/s and occurs at 37 h from the start of the rainfall excess. Assuming the catchments M and N are meteorologically similar; determine the elements of the 6-h synthetic unit hydrograph for catchment N by using Snyder’s method.
Answer
-
a. For catchment M
tr = 6 h
Time to peak from beginning of ER
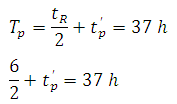
t'p = 34h
From equation
tp = 34.047
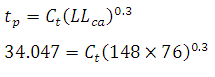
ct = 2.073
Cp = 0.899 ≈ 0.9
b. For catchment N
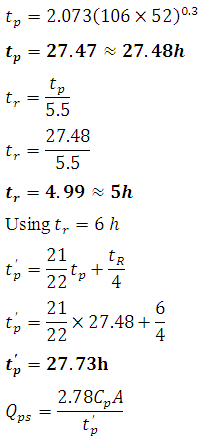
Using
References
Subramanya, K. (2008). Engineering Hydrology.Third edition, Tata McGraw Hill, 225-229.
Suggested Reading
Singh, V. P. (1994). Elementary Hydrology.Prentice Hall of India Private Limited,New Delhi.
Suresh R. (2007). Soil and Water Conservation Engineering. Fourth edition, Standard Publishers Distributors, New Delhi.
Murty, V.V.N. and Jha, M.K. (2009).Land and Water Management Engineering.Fifth edition, Kalyani Publishers, Ludhiana.
Last modified: Saturday, 15 March 2014, 6:44 AM