Site pages
Current course
Participants
General
Module 1: Introduction and Concept of Soil Erosion
Module 2: Water Erosion and Control
Module 3: Wind Erosion, Estimation and Control
Module 4: Soil Loss- Sediment Yield Estimation
Module 5: Sedimentation
Module 6: Topographic Survey and Contour Maps
Module 7: Land Use Capability Classification
Module 8: Grassed Waterways
Module 9: Water Harvesting
Module 10: Water Quality and Pollution
Module 11: Watershed Modeling
Keywords
Lesson 17 Erosivity and Erodibility
Soil degradation is indicated by lowering of the fertility status, by a reduction of the nutrient level or by physical loss of topsoil. The latter condition, mostly occurs in regions prone to soil erosion where during heavy rainfall considerable amounts of soil, rock debris and organic matter are transported down slope to rivers and eventually to the sea. Soil erosion control can be attained by knowing soils’ susceptibility and the factors responsible for the susceptibility. Generally, the quantity of erosion yield is dependent upon the ability of rain to detach the soil particles (i.e., erosivity of rainfall) and at the same time the susceptibility of soil to withstand against the raindrop (i.e., erodibility of soil). Thus, the soil erosion is the function of both erosivity and erodibility. When rainfall erosivity exceeds the soil erodibility, soil erosion occurs.
17.1 Erosivity of Rainfall
Rainfall erosivity is a term that is used to describe the potential for soil to be washed off from disturbed, de-vegetated areas and move with into surface waters during storms. It may also be defined as the potential ability of rain to cause the erosion. It is dependent upon the physical characteristics of rainfall, which include raindrop size, drop size distribution, kinetic energy, terminal velocity, etc. For a given soil condition, the potential of two storms can be compared quantitatively, regarding soil erosion to be caused by them. The power of overland runoff flow to erode soil material is partly a property of the rainfall, and partly of the soil surface. Rainfall erosivity is highly related to soil loss. Increased rain erosivity indicates greater erosive capacity of the overland water flow. Soil erosion by running water occurs where the intensity and duration of rainstorms exceeds the capacity of the soil to infiltrate the rainfall. The potential for erosion is based on many factors which include including soil type, slope, and the energy or force of precipitation expected during the period of surface disturbance.
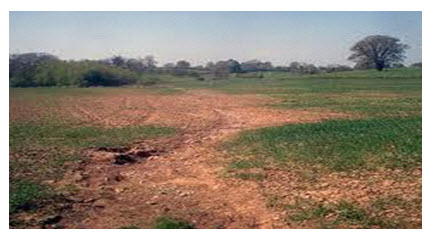
Fig. 17.1. Tilled Farmland Very Susceptible to Erosion from Rainfall.
17.1.1 Factors Affecting Rainfall Erosivity
The various factors, which affect the erosivity of rain storm, are given as under:
1) Rainfall Intensity
Rainfall intensity refers to the rate of rainfall over the land surface. It is one of the most important factors responsible for the erosive nature of rainfall. The rainfall intensity is assumed as the force, by which an individual water droplets strikes over the soil surface. The kinetic energy is related to the intensity of rainfall by the equation proposed by Wischmeier and Smith (1958) as follows:

where, KE = kinetic energy of rainfall, tons per ha per cm of rainfall, and I = rainfall intensity (cm/h).
2) Drop Size Distribution
The drop size distribution in a particular rainstorm influences the energy, momentum and erosivity of the rain in cumulative way. The increases in median drop size, increases the rainfall intensity. The relationship between the median drop size (D50) and rainfall intensity, is given as under (Laws and Parsons, 1943):
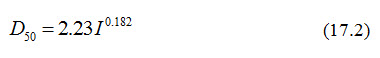
In which, D50 is the median drop size (inch) and I is the intensity (inch/h).
3) Terminal Velocity
The effect of terminal velocity of falling raindrops is counted in terms of kinetic energy of respective rain drops at the time of their impact over the soil surface. It is the function of drop size. A rainstorm composed of large proportion of bigger size raindrops, has greater terminal velocity and vice-versa. The kinetic energy of rain storm has following relationship with terminal velocity, as:
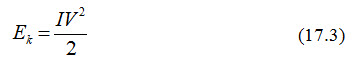
where,
Ek = rainfall energy (watts /m2)3, I = Intensity of rainfall (mm/s), and V = Terminal velocity of rainfall before impact (m/s).
Ellison (1947) developed an empirical relationship among the terminal velocity, drop diameter and rainfall intensity, for computing the amount of soil detached by the rainfall as:
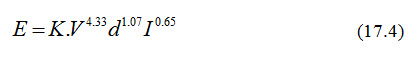
where, E = relative amount of soil detached, K = a constant, depends upon the soil characteristics, V = velocity of raindrop (feet/s), d = drop diameter (mm), and I = rainfall intensity (inch/h).
4) Wind Velocity
Wind velocity affects the power of rainfall to cause soil detachment, by influencing the kinetic energy of rain storm. Tropical regions experience the occurrence of windy storm most of the times. Wind driven storms are more effective than anticipated for breaking the aggregates. The effect of wind velocity on soil detachment by rain storm is shown in Table 1.
Table 17.1. Effect of Wind Velocity on Soil Detachment at Different Intensities of Rain Storm. (Source: Lyles et.al, 1969)
|
Wind Velocity (m/s) |
Intensity of Rain ( cm/h) |
||
|
1.6 |
2.84 |
5.61 |
|
|
|
% Soil Detachment (arbitrary unit) |
||
|
0 |
56 |
93 |
97 |
|
6.7 |
95 |
98 |
97 |
|
13.4 |
97 |
100 |
100 |
5) Direction of Slope
The direction of land slope also develops significant effect on rainfall erosivity. Slope direction in the direction of the rain storm, effectively alters the actual kinetic energy of the rain drop. It increases the impact force of the raindrop as the velocity component in the direction of slope becomes more.
17.1.2 Estimation of Erosivity from Rainfall Data
The rainfall erosivity is related to the kinetic energy of rainfall. The following two methods are widely used for computing the erosivity of rainfall.
1. EI30 Index method and
2. KE > 25 Index method.
1. EI30 Index Method
This method was introduced by Wischmeier (1965). It is based on the fact that the product of kinetic energy of the storm and the 30-minute maximum rainfall intensity gives the best estimation of soil loss. The greatest average intensity experienced in any 30 minute period during the storm is computed from recording rain gauge charts by locating the maximum amount of rain which falls in 30 minute period and later converting the same to intensity in mm/hour. This measure of erosivity is referred to as the EI30 index and can be computed for individual storms, and the storm values can be added over periods of time to give weekly, monthly or yearly values of erosivity.
The rainfall erosivity factor EI30 value is computed as follows:
![]()
where KE is rainfall kinetic energy and I30 is the maximum rainfall intensity for a 30-minute period. Kinetic energy for the storm is computed from Eqn. 17.1.
Limitation
The EI30 index method was developed under American condition and is not found suitable for tropical and sub-tropical zones for estimating the erosivity.
2. KE > 25 Index Method
This is an alternate method introduced by Hudson for computing the rainfall erosivity of tropical storms. This method is based on the concept that erosion takes place only at threshold value of rainfall intensity. From experiments, it was obtained that the rainfall intensities less than 25 mm/h are not able to yield the soil erosion in significant amount. Thus, this method takes care of only those rainfall intensities, which are greater than 25 mm/h. That is why the name is K.E. > 25 Index method. It is used in the same manner as the EI30 index and the calculation procedure is also similar.
Calculation Procedure
The estimation procedure is same for both the methods. However, K.E. > 25 method is more advantageous, because it sorts out many data less than 25 mm/h, hence uses less rainfall data. For both the methods, it is important to have data on rainfall amount and its intensity.
The procedure involves the multiplication of rainfall amounts in each class of intensity to the computed kinetic energy values and then all these values are added together to get the total kinetic energy of the storm. The K.E. so obtained, is again multiplied by the maximum 30-minute rainfall intensity to determine the rainfall erosivity value.
17.2 Soil Erodibility
Soil erodibility is an estimate of the ability of soils to resist erosion based on the physical characteristics of each soil. Generally, soils with faster infiltration rates, higher levels of organic matter and improved soil structure have a greater resistance to erosion. Sand, sandy loam and loam textured soils tend to be less erodible than silt, very fine sand, and certain clay textured soils (Fig. 17.2). On the basis of erodibility, a soil can be compared quantitatively with the other soils for a given rainfall condition. Bouyoucos (1935) suggested that the soil erodibility depends on mechanical composition of soil, such as sand, silt, and clay, presented by the ratio as:
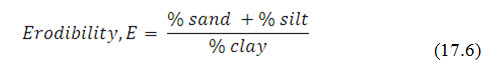
The range of particle diameter of clay, sand and silt is:
Clay = < 0.002 mm
Silt = 0.002 – 0.006 mm
Sand = 0.06 - 2.0 mm.
This indicator is reliable only in some cases.
Tillage and cropping practices which lower soil organic matter levels, cause poor soil structure, and result in soil compactness contribute to increases in soil erodibility. Decreased infiltration and increased runoff can be a result of compacted subsurface soil layers. A decrease in infiltration can also be caused by a formation of a soil crust, which tends to "seal" the surface. On some sites, a soil crust might decrease the amount of soil loss from sheet or rain splash erosion, however, a corresponding increase in the amount of runoff water can contribute to greater rill erosion problems.
Past erosion has an effect on soil erodibility for a number of reasons. Many exposed subsurface soils on eroded sites tend to be more erodible than the original soils were, because of their poorer structure and lower organic matter. The lower nutrient levels often associated with subsoils contribute to lower crop yields and generally poorer crop cover, which in turn provides less crop protection for the soil.
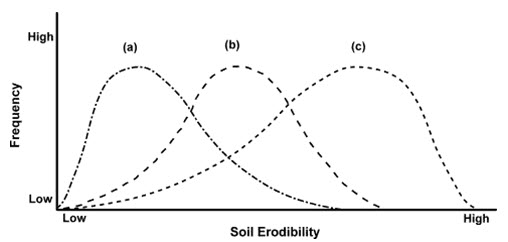
Fig. 17.2. Conceptual Diagram Showing the Frequency Distributions of Three Soils in the Erodibility Continuum. These could Represent the Same Soil Type under Three Levels of Disturbance Intensity, for example Under Low (a), Moderate (b) or High (c) Stocking Rates or the Responses of Three Different Soils, for example A Clay (a), A Loam (b) and A Sand (c) to A Similar Level of Disturbance. (Source: www.Sciencedirect.com)
17.2.1 Erodibility Determination
Erodibility is defined as the resistance of the soil to both detachment and transport. It varies with soil texture, aggregate stability, shear strength, infiltration capacity and organic and chemical content. Erodibility of a soil is designated by the soil erodibility factor K. There are several approaches to determine K and the three major ones are discussed as given below.
Use of in situ erosion plots
Measuring K under a simulated rainstorm
Predicting K using regression equations describing the relationship between K and soil physical and chemical properties.
In Situ Erosion Plots
Erosion plots enable measurement of K under field conditions. They make use of a standard condition of bare soil with no conservation practice and 7° slope of 22.13 m length of plots. This approach is costly and time consuming.
Measuring K under a Simulated Rainstorm
This approach is less time consuming but relatively costly. The main drawback is that none of the rainfall simulators built to date can recreate all the properties of natural rain. Nevertheless this method is being used more extensively in erosion studies.
The rainfall simulator, generally used in this study, is made of Duction bars. It measures 1.80 m both in length and width and is 3.80 m high. Several kinds of nozzle are tested and the one that produces water droplets close to natural rain is chosen. Water is released at a low pressure. A wooden tray of dimension 1 m by 2 m and 15 cm deep is placed under the simulator with the slope adjusted to 7°. A collecting structure is placed at the downslope end to gather runoff and sediment. Soil samples collected from different erosion-sensitive regions are placed in the wooden tray. The soil is then subjected to simulated rainstorm of different intensities. Since, it is difficult to set predetermined rainfall intensity, the nozzle is adjusted to low and high levels and the depth of water reaching the wooden tray is measured using a beaker throughout the experiment. Total volume of runoff and sediment are collected and measured.
Predicting K
K may be predicted using regression equations describing the relationships between K and soil chemical and physical properties. The nomograph developed by Wischmeier et al. (1971) expressing the relationship between K and soil properties is based on the following equation:
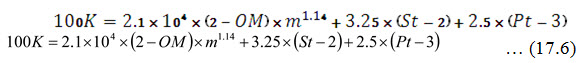
where, OM = Organic matter content (%), m = Silt plus fine sand content (%), St = Soil structure code (very fine granular = 1; fine granular = 2; coarse granular = 3; blocky, platy or massive = 4), Pt = Permeability class (rapid = 1, moderate to rapid = 2, moderate = 3, slow to moderate = 4, slow = 5, very slow = 6), and K is predicted using the nomograph devised by Wischmeir et al. (1971).
17.3 Relationship between Rainfall Energy and Soil Erosion
It is well-established that the amount of soil that is detached by a particular depth of rainfall is related to the intensity at which this rain falls. The results of various studies further suggest that soil splash rate is a combined function of rainfall intensity and some measure of raindrop fall velocity (Ellison, 1944).
The relationship is given by:
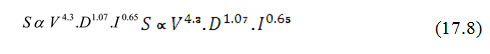
where, S = quantity of soil splashed in 30 minutes duration, V = velocity of raindrop, ft./s, D = diameter of raindrop, mm and I = intensity of rainfall, inch/h.
Raindrop diameter in storms of varying intensity can be observed for each region, resulting in regressions such as: energy of a storm = energy of each segment of rain falling at a given intensity multiplied by the number of millimeters fallen at this intensity (Bisal, 1960).
The expression is given by:
![]()
where, G = weight of soil splashed in gm, K = constant, depends upon the soil type, D = drop diameter in mm, and V = impact velocity in m/s.
This impact energy is dissipated in four ways:
Compression of the soil under the rain's impact, following rapid moistening of the soil surface;
Crushing and shearing stress: separation of aggregated particles;
Projection of elementary particles in a crown formation on flat soil and transport in all directions but most effectively downhill on slopes.
Noise of the impact of the drops on resistant material.
Hudson (1965 and 1973) working in Zimbabwe, and Elwell and Stocking (1975) working on well-structured ferralitic soils (oxisols), found the best relation between erosion and raindrop energy above a certain threshold intensity (I > 25 mm/h) (E = K E, if I > 25 mm/h).
The above authors observed that only intense rain leads to erosion. However, it is likely that any rain will have some ill effect on the soil surface, even if not all rains produce runoff. , But they may foster the development of a fairly impermeable crust and accelerate runoff in future storms.
On the basis of mass and velocity of raindrop, Mihara (1959) also reported that the splash erosion is directly correlated with the kinetic energy of the raindrop. He developed the following relationship for two different types of soil, given as:
For sandy soil,
Splash erosion ![]() K.E.0.9 and
K.E.0.9 and
For clay soil,
Splash erosion ![]() K.E.1.46
K.E.1.46
Solved Example
Find out the total kinetic energy of rainfall and also its erosivity using EI30 and K.E.> 25 index methods for the following given rainfall amount and intensity values.
Solution:
1. EI30 Index Method:
|
Intensity (cm/h) |
Amount (cm) |
Energy (metric tones/ha/cm) |
Total ( col.2 × col.3) |
|
(1) |
(2) |
(3) |
(4) |
|
1.5 |
3 |
231.97 |
695.91 |
|
2.5 |
0.75 |
245.71 |
184.28 |
|
3.5 |
1.25 |
258.72 |
323.40 |
|
4.5 |
2.58 |
268.43 |
692.56 |
|
5.5 |
3.57 |
276.19 |
986.00 |
|
|
2882.15(metric tones/ha.) |
||
Kinetic energy is calculated by the Eqn. 17.1;
Let I30 is taken to be 45 cm/h, the rainfall erosivity is given as
EI30 = 2882.15 × 45 = 129696.75 metric tonnes/ha.cm/hr. Ans.
2. K.E. > 25 Method:
|
Intensity (cm/h) |
Amount (cm) |
Energy (tons/ha cm) |
Total (col.2 × col. 3) |
|
(1) |
(2) |
(3) |
(4) |
|
0.015 |
0.5 |
47.97 |
23.98 |
|
1.5 |
2.52 |
225.97 |
569.44 |
|
1.67 |
0.021 |
230.12 |
4.83 |
|
0.025 |
0.75 |
67.71 |
50.78 |
|
|
569.44 m tons/ha |
||
For calculation of total kinetic energy, corresponding terms for rainfall intensity of less than 25 mm/h have not been considered. According to this method,
EI30 = 569.44 × 45 = 25624.28 t/ha cm/h Ans.
Keywords: EI30 Index Method, Erodibility, Erosivity, KE > 25 Index Method.
References
Murty V.V.N., and Jha, M. K., 1985, Land and Water Management Engineering, Kalyani Publishers, pp. 600.
Suresh R., 2007, Soil and water conservation engineering, Second Edition, Standard Publishers Distributors, New Delhi, pp. 323-344.
Atawoo M. A., Heerasing J. M., 1997, Estimation of Soil Erodibility and Erosivity of Rainfall Patterns In Mauritius, Agricultural Research and Extension Unit, AMAS, Food and Agricultural Research Council, Réduit, Mauritius, pp. 219-223.
Wischmeier, W.H., Johnson, C.B. and Crors, B.V., 1971, A soil erodibility nomograph for farmland and construction sites, Journal of soil and water conservation 26: pp.189-193.
www.fao.org/docrep/t1765e/t1765e0d.htm
Suggested Readings:
Hudson N., 1971, Soil Conservation, B.T. Batsford Ltd., London.
Laws, J.O. and Parsons, D. A., 1943, The relation of raindrop size to intensity, Trans. American Geophysical Union, 24: 452- 459.
Moore I, Burch G., 1986a, Physical basis of the length-slope factor in the Universal Soil Loss Equation, Soil Science Society of America Journal 50: 1294–1298.
Last modified: Saturday, 21 December 2013, 5:26 AM