Site pages
Current course
Participants
General
Module.1 Introduction of Water Resources and Hydro...
Module.2 Precipitation
Module.3 Hydrological Abstractions
Moule.4 Types and Geomorphology of Watersheds
Module 5. Runoff
Module 6. Hydrograph
Module 7. Flood Routing
Module 8. rought and Flood Management
Lesson 24 Unit Hydrograph
24.1 Definition of Unit Hydrograph
This method was first suggested by Sherman in 1932
A unit hydrograph is defined as the hydrograph of direct runoff resulting from one unit depth (1 cm) of rainfall excess occurring uniformly over the basin and at a uniform rate for a specified duration (D hours).
The definition of a unit hydrograph implies the following:
- The unit hydrograph represents the lumped response or the catchment to a limit rainfall excess of D-hduration to produce a direct-runoff hydrograph. It relates only the direct runoff to the rainfall excess. Hence the volume of water contained in the unit hydrograph must be equal to the rainfall excess. As 1 cm depth of rainfall excess is considered the area of the unit hydrograph is equal to a volume given by 1cm over the catchment.
- The rainfall is considered to have an average intensity of excess rainfall (ER) of 1/D cm/h for the duration D-hof the storm.
- The distribution of the storm is considered to be uniform all over the catchment.
Example 1
The ordinates of a hydrograph of surface runoff resulting from 4.5 cm of rainfall excess of duration 8 h in a catchment are as follows:
|
Time |
(h) |
0 |
5 |
13 |
21 |
28 |
32 |
35 |
41 |
|
Discharge |
(m3/s) |
0 |
40 |
210 |
400 |
600 |
820 |
1150 |
1440 |
|
Time |
(h) |
45 |
55 |
61 |
91 |
98 |
115 |
138 |
|
|
Discharge |
(m3/s) |
1510 |
1420 |
1190 |
650 |
520 |
290 |
0 |
Determine the ordinates of the 8-h unit hydrograph for this catchment.
Answer
|
C1 |
C2 |
C3 |
C4=C2/C3 |
|
Time |
DRH |
Excess Rainfall |
8-h UH |
|
h |
m3/s |
cm |
m3/s |
|
0 |
0 |
4.5 |
0.0 |
|
5 |
40 |
4.5 |
8.9 |
|
13 |
210 |
4.5 |
46.7 |
|
21 |
400 |
4.5 |
88.9 |
|
28 |
600 |
4.5 |
133.3 |
|
32 |
820 |
4.5 |
182.2 |
|
35 |
1150 |
4.5 |
255.6 |
|
41 |
1440 |
4.5 |
320.0 |
|
45 |
1510 |
4.5 |
335.6 |
|
55 |
1420 |
4.5 |
315.6 |
|
61 |
1190 |
4.5 |
264.4 |
|
91 |
650 |
4.5 |
144.4 |
|
98 |
520 |
4.5 |
115.6 |
|
115 |
290 |
4.5 |
64.4 |
|
138 |
0 |
4.5 |
0.0 |
24.2 Assumptions of Unit Hydrograph Theory
- The effective rainfall is uniformly distributed within its duration or specified period of time.
- The effective rainfall is uniformly distributed over the whole area of drainage basin
- The time base of the direct runoff hydrograph, i.e., the duration of the direct runoff hydrograph, depends only on the effective rainfall duration, and is independent of the effective rainfall intensity.
- The response of the drainage basin is linear. This implies that the principles of proportionality and superpositionare applicable.
As per proportionality principle, the DRH ordinates are proportional to the effective rainfall intensity.
Similarly, as per superposition principle, DRH ordinates due to a complex storm, having varying effective rainfall intensities, can be obtained by superimposing the DRH due to each element of effective rainfall in succession.
5. The unit hydrograph reflects the basic effects of various physical characteristics of the basin, which do not change in time. This implies that the principle of time invarianceis valid.
The definition of the UH together with these assumptions constitutes what is now called the unit hydrograph theory.
Since in practice, assumption (1) and (2) are never satisfied, these forms the limitations of unit hydrograph theory.
Unit hydrograph theory can be applied only for a basin having drainage area between 200 ha to 5, 00,000 ha
24.3 Uses of Unit Hydrograph
- Development of flood hydrograph for extreme rainfall magnitudes for use in the design of hydraulic structures.
- Extension of flood-flow records based on rainfall records.
- Development of flood forecasting and warning systems based on rainfall.
24.4 Application of Unit Hydrograph
Let it be assumed that a D-hunit-hydrograph and the storm hyetograph are available. The initial losses and infiltration losses arc estimated and deducted from the storm hydrograph to obtain the ERH. The ERH is then divided into M blocks of D-h duration each. The rainfall excess in each D-hduration is then operated upon the unit hydrograph successively to get the various DRH curves. The ordinates of these DRHs are suitably lagged to obtain the proper time sequence and are then collected and added at each time element to obtain the required net DRH due to the storm.
Consider Fig. 24.1 in which a sequence of M rainfall excess values R1, R2, R3… Rm each of duration D-h duration is shown. The line u[t]is the ordinate of a D-h unit hydrograph at t h from the beginning.
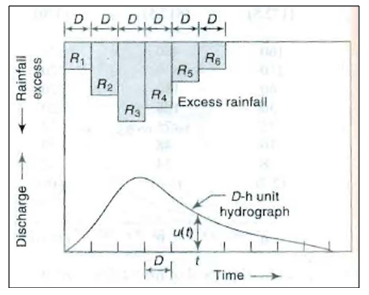
Fig. 24.1.DRH due to an ERH. (Source: Subramanya,2008)
The direct runoff' due to R1 at time t is
![]()
The direct runoff due to R1at time (t -D)is
![]()
Similarly,
![]()
and
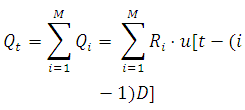
Thus at any time t, the total direct runoff is
After deriving the net DRH, the estimated base flow is then added to obtain the total flood hydrograph.
Example 2
The ordinates of a 6-h unit hydrograph area given:
|
Time |
(h) |
0 |
3 |
6 |
9 |
12 |
15 |
18 |
21 |
|
6-h UH Ordinates |
(m3/s) |
0 |
150 |
250 |
450 |
600 |
700 |
800 |
750 |
|
Time |
(h) |
24 |
30 |
36 |
42 |
48 |
54 |
60 |
66 |
|
6-h UH Ordinates |
(m3/s) |
700 |
600 |
450 |
320 |
200 |
100 |
50 |
0 |
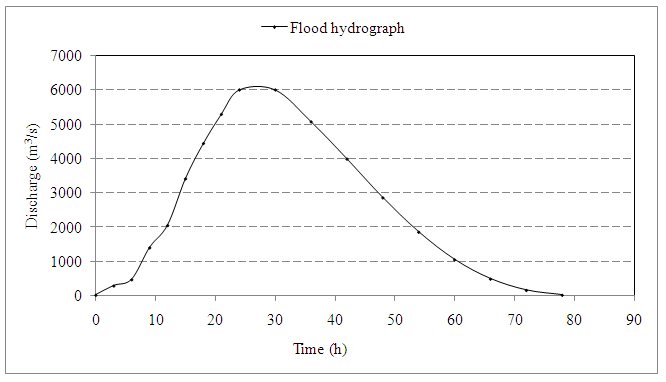
A storm had three successive 6-h intervals of rainfall magnitude of 3.0, 5.0, and 4.0 cm, respectively. Assuming aindex of 0.20 cm/h and base flow of 30 m3/s, determine and plot the resulting hydrograph of flow.
Answer
|
|
(1) |
(2) |
(3) |
|
Rainfall, (cm) |
3 |
5 |
4 |
|
Ø index, (cm/h) |
0.20 |
0.20 |
0.20 |
|
Time interval ,(h) |
6 |
6 |
6 |
|
losses (Ø * Δt), (cm) |
1.2 |
1.2 |
1.2 |
|
Excess rainfall (Rainfall-Initial losses), (cm) |
1.8 |
3.8 |
2.8 |
|
C1 |
C2 |
C3=C2*1.8 |
C4=C2*3.8 |
C5=C2*2.8 |
C6= C3+C4+C5 |
C7 |
C8= C7+C6 |
|
Time |
6-h UH |
DRH due to |
DRH due to |
DRH due to |
|
Base flow |
Ordinates of flood |
|
|
|
1.8 cm ER |
3.8 cm ER |
2.8 cm ER |
|
|
hydrograph |
|
|
|
|
lagged by 6-h |
lagged by 12-h |
|
|
|
|
h |
m3/s |
m3/s |
m3/s |
m3/s |
m3/s |
m3/s |
m3/s |
|
0 |
0 |
0 |
|
|
0 |
30 |
30 |
|
3 |
150 |
270 |
|
|
270 |
30 |
300 |
|
6 |
250 |
450 |
0 |
|
450 |
30 |
480 |
|
9 |
450 |
810 |
570 |
|
1380 |
30 |
1410 |
|
12 |
600 |
1080 |
950 |
0 |
2030 |
30 |
2060 |
|
15 |
700 |
1260 |
1710 |
420 |
3390 |
30 |
3420 |
|
18 |
800 |
1440 |
2280 |
700 |
4420 |
30 |
4450 |
|
21 |
750 |
1350 |
2660 |
1260 |
5270 |
30 |
5300 |
|
24 |
700 |
1260 |
3040 |
1680 |
5980 |
30 |
6010 |
|
30 |
600 |
1080 |
2660 |
2240 |
5980 |
30 |
6010 |
|
36 |
450 |
810 |
2280 |
1960 |
5050 |
30 |
5080 |
|
42 |
320 |
576 |
1710 |
1680 |
3966 |
30 |
3996 |
|
48 |
200 |
360 |
1216 |
1260 |
2836 |
30 |
2866 |
|
54 |
100 |
180 |
760 |
896 |
1836 |
30 |
1866 |
|
60 |
50 |
90 |
380 |
560 |
1030 |
30 |
1060 |
|
66 |
0 |
0 |
190 |
280 |
470 |
30 |
500 |
|
72 |
|
0 |
0 |
140 |
140 |
30 |
170 |
|
78 |
|
0 |
0 |
0 |
0 |
30 |
30 |
References
Subramanya, K.(2008). Engineering Hydrology.Third edition, Tata McGraw Hill, 205-211.
Suggested Readings
Singh, V. P. (1994). Elementary Hydrology.Prentice Hall of India Private Limited,New Delhi.
Murty, V.V.N. and Jha, M.K. (2009).Land and Water Management Engineering.Fifth edition, Kalyani Publishers, Ludhiana.
Suresh R. (2007). Soil and Water Conservation Engineering.Fourth edition, Standard Publishers Distributors, New Delhi.
Last modified: Saturday, 15 March 2014, 6:39 AM