Site pages
Current course
Participants
General
Module 1. Introduction about design and developmen...
Module 2. Study of special design features of trac...
Module 3. Study of basic design parameters for tra...
Module 4. Selection of different mechanical power ...
Module 5. Study of tractor steering and suspension...
Module 6. Design and analysis of tractor hitch sys...
Module 7. Design of a tractor hydraulic system
Module 8. Study of electrical, electronics and gui...
Module 9. Ergonomics, controls and safety features...
Module 10. Tractor testing
Module 11. General revision
Appendices & References
Lesson 8. Traction mechanics and its prediction
1. Introduction
The study of traction mechanics includes soil - implement and soil - vehicle mechanics in general. Two approaches can be used for traction prediction
(a) Empirical
Here experimental data on the drawbar pull and rolling resistance of various wheels together with a single soil parameter (the cone index obtained by measuring the force to push a cone penetrometer into the soil) are used to predict drawbar pull and rolling resistance on a purely empirical basis (Wismer and Luth, 1974). Such an approach provides a ready and useful means of performance prediction but it is not suitable as a basis for understanding the traction process;
(b) Theoretical
Theoretical approach uses classical soil properties like cohesion, angle of internal friction and some semi - empirical parameters to develop a model for the prediction of the tractive force (soil reactions) and drawbar pull. This approach provides the best understanding of the traction process and an appropriate introduction. The theoretical / predictive approach provides the best basis for understanding tractive performance and will be emphasised here; the other approaches may be more readily used for the immediate determination of wheel performance.
The usual approach is by considering the prediction of tractor performance is to begin with the study of the performance of single wheel. The performance of the tractor is then understood as the combined interaction and performance of two or more such wheels. The traditional four-wheel tractor is a combination of driven (or braked) wheels at the rear and free rolling, towed (pushed) wheels at the front.
2. Tractive Performance
The early study of the performance of tractors was limited to the experimental measurement of travel speed and wheel slip at various drawbar pulls on soils. The results were intended to provide an understanding of the principles involved and a basis for comparing the relative performance that farmers might expect from the various tractors in the field. Rolling resistance of wheels was measured by equating it to the towing force required to move different types of (mainly transport) wheels across visually described surfaces, eg. road (hard), stubble (firm), cultivated soil (soft) etc.
The theoretical prediction of tractive performance has involved the separation of the problem into two parts, viz,the prediction of:
(i) Tractive force, H
(ii) Rolling resistance, R
Using this approach it is assumed that the drawbar pull (P) is what remains of the tractive force after the rolling resistance has been overcome, ie:
![]() ... (8.1)
... (8.1)
Where,
P(s) implies that P will be determined as a function of slip
H(s) implies that H will be predicted as a function of slip
While R is also a function of slip, this function is not known and hence the value for R is that measured under the towed condition or predicted, both of which assume zero slip. Clearly this is only approximate because the rolling resistance under finite slips will be greater than the value measured or predicted with zero slip. The generation of a tractive force by the tractor requires an equal and opposite horizontal reaction by the soil against the driving wheels in the contact area. This reaction force, which in effect determines the tractor performance, is predicted on the basis of the soil strength parameters (c and f) and the soil deformation corresponding to various wheelslip values.
The support of the tractor requires a vertical reaction on the wheels which causes vertical deformation of the soil in the contact area. Equating the energy to deform the soil (ie. to make the rut) to the work done by the rolling resistance force provides a basis for calculation of the latter. The process is modelled by the pressure – sinkage relationship for a plate pressed into the soil; slip is considered to be zero.
i. Measurement of Rolling Resistance:
The rolling resistance of a wheel is, in general terms, the force opposing the motion of the wheel as it rolls on a surface. This force arises from the energy losses that occur due to
The elastic but non-ideal deformation of the wheel
The inelastic and non-recoverable (plastic) deformation of the surface
Friction in the wheel bearings (usually assumed to be negligible)
From this it will be clear that the rolling resistance of a wheel will be a function of the strength deformation properties of the surface and the size and deformation characteristics of the wheel. For wheels with tyres, the secondary factors include the air pressure, the structure of the tyre carcass (radial or bias ply) and the tread pattern. For speeds used with agricultural tractors, rolling resistance is relatively independent of the speed of deformation of the soil and the tyre, hence of the travel speed.
The ideal is a perfectly rigid wheel rolling on a perfectly rigid surface. This defines the kinematics of the rolling wheel. Hard wheel on a hard surface, this is approximated to by an elastic steel wheel rolling on an elastic steel track as in a railway.Hard wheel on soft surface. Here most of the deformation and energy loss occurs in the surface which yields plastically but does not recover. Tractor front wheels and implement wheels with 'high' pressure tyres, operating on soft agricultural soil, are of this type.Soft wheel on hard surface. Here most of the deformation and energy loss occurs in the wheel and appears as heat. Tractor driving wheels and vehicle wheels both operating on road surfaces are of this type.Soft wheel on soft surface. Here both the wheel and the surface deform significantly as in the tractor rear wheel operating on soft soil. Energy loss occurs mainly in deforming the soil.
One major aspect of understanding and predicting tractor performance is that of determining the rolling resistance of a wheel as it is towed without slip over the surface. The problem of determining the rolling resistance of a driving wheel, when slip is present, is more complex. When a wheel rolls over a soft surface it makes a rut or compacted track. The simplest basis for the prediction of its rolling resistance is to therefore assume that the work done against the rolling resistance is the work done in compacting the soil. Bekker (1956) assumed that the wheel was equivalent to a plate continuously being pressed into the soil to a depth equal to the depth of the rut produced by the wheel.
ii. Maximum Tractive Force:
The horizontal force transmitted between a machine and the soil has a limiting value which depends on both the soil strength and machine design parameters. The contact area of a driving tire is approximately flat as shown in Fig.8.1, within certain limits of soil stiffness and tire inflation pressure which will be explained later. The magnitude of the area of all driving wheels can be estimated as:
iii. Estimation of Contact Area:
A very rough approximation of the contact area is given by
![]() ... (8.2)
... (8.2)
But, a flexible tire has a smaller contact area on hard surfaces than it does on soft ground. A rule of thumb which can be used for the estimation of tire contact area is shown in Fig. 8.1.
A = bL
Where,
b = tire section width
L = d/4 on a hard surface
L = d/2 on a soft surface (tire sinkage z > 0.05 d)

Fig. 8.1: Plate being pushed into the soil as tractor tyre to calculate the contact area and pressure
In addition Wong (1978) and Bekker (1985) gave an approximate method to calculate length from the maximum tire deflection δt
![]() ... (8.3)
... (8.3)
iv. Maximum Shear Strength of Soil:
Coulomb (1776) noted that there appeared to be two mechanical processes in action which determine the ultimate shearing strength of soil-tool interaction. One process is called friction(internal angle of friction Ø) and the other cohesion (c). The total material shear strength is the sum of these two components as follows
![]() ... (8.4)
... (8.4)
Where p is the normal pressure acting on the internal shear surface in question
The lugs on tires penetrate the soil surface, unless it is very hard in order to hold soil among them and to cause the development of soil to soil strength on the horizontal tractive surface.
The maximum force value, is the summation of the soil shear strength over the total contact area of all the driving tires
![]() ... (8.5)
... (8.5)
In which, ΣA = The sum of contact areas of all driving wheels of tractor
ΣV = The sum of vertical forces on all the driving wheels of tractor
The machine design specifications which can be changed to alter the maximum traction force are the driver contact area and the weight on the drivers. On a course granular material which is cohesion less, it is only the increase in vehicle weight that can improve the traction effort. When the soil is a wet fine grained material with a small total angle of internal friction, it is the contact area which should be enlarged for better traction and this is the reason for the popularity of wide tires large diameter tires or duel or even triple tire sets on tractors which operate on clayey terrain.
v. Soil Deformation and Slip:
Because soil is not a perfectly rigid material, it deform under the action of stresses. The horizontal deformation of the soil surface in reaction to a traction force of low pressure tire is very similar to that observed in the rectangular shear plate soil strength test by Coulomb. Bekker(1956) suggested that the horizontal deformation versus shear stress response of a plastic soil, such as sand or wet clay is observed to be close to an exponential curve of the following form
Horizontal shear stress will be
![]() ...(8.6)
...(8.6)
Where,
S = Soil shear strength = c + p tanØ
X' = Horizontal deformation of the soil surface
K = a soil stiffness coefficient
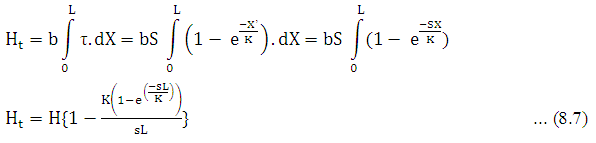
The final or maximum horizontal deformation of the soil surface will be X’m, which can be related to wheel slip (s) and contact length (L) of a tire, assuming that the tire maintains a relatively rigid length
![]()
Soil deformation X’, varies along the contact length and the shear stress between soil and machine will also vary according to the equation for a plastic soil. The total traction thrust can be calculated by integrating the shear stress distribution over the contact area.
Bekker (1960) and Wong (1978) have shown that one can develop some more complicated stress deformation relationships for soils which suffer some loss of strength with extensive shearing. They also pointed out the importance of the length of a tire contact area in the traction phenomenon.
vi. Work done to deform soil:
a) Sinkage in Soil:
The stress distribution in a soil under an object having a vertical load is more complex than the horizontal thrust strength relation. Penetration into the soil begins at small loads with accompanying shear strains, which are less than those required to develop failure. After local shear failure has occurred, a wedge of soil beneath the sinking structure continues to descend, but an increasing penetration load is needed in order to 1ft (30 cm) larger depths of “surcharge soil above and to the sides of the object.
Natural soil exhibits a gradual change in load required for the transition between two states and a smooth variation with increasing penetration force is observed. Bernstein (1913) and Goriatchkin (1937) (cited by Bekker, 1956) and the following equation was proposed to describe it.
p = k. Zn ... (8.8)
where,
p = vertical average contact pressure
k = a soil stiffness constant for sinkage
z = sinkage distance into the soil
n = a soil constant
The principal deficiency of this equation for prediction of machine sinakge and performance was found to be the variability of the soil stiffness constant, k with the size of the object on the soil.
For a plate, length l, width b, being pressed into the soil, as in Fig.8.2, Bekker suggested that the pressure, p under such a plate is given by:
![]() ... (8.9)
... (8.9)
where,
z is vertical soil deformation (sinkage)
Kc and KØ are soil stiffness or sinkage constant
n is soil sinkage exponent
b is the smaller overall dimension (width of rectangular plate or radius of circular disc) of the plate

Fig. 8.2: Plotting to calculate slopes and intercept for different plates with different widths
b) Measuring soil parameters
Because the work to compact the soil is used as the basis of prediction of rolling resistance, the force to push a plate into the soil and the associated sinkage is chosen as an appropriate method of determining the soil parameters for the calculation of rolling resistance.
To obtain the parameters, a series of plates of different widths, b1, b2, b3 are pushed into the soil while the force and corresponding sinkage are measured.
![]() ...(8.10)
...(8.10)
When, log p is then plotted against log z, we get a series of straight lines of slope 'n' and intercept on the log p axis = (Kc / b + Kf) as shown in Fig. 8.2. Further if the intercepts are then plotted against 1/b the slope of this line is and the intercept at 1/b is kf.
vii. Rolling Resistance:
Rolling resistance is the force opposing horizontal motion on a deformable surface or on flexible tires.It can be considered as a rate of energy loss to the soil and /or tires. It has been known in practice that the rolling resistance of a tire increases both with the vertical load on the wheel and with the sinkage of the tire into the soil. Industry rules of thumb are available for approximate calculations for earthmoving tires in a range of outside diameters from 150 to 300 cm are shown in Table 8.1.
Table 8.1: Coefficient of rolling resistance (R/N) on soils of different stiffness (Caterpillar, 1968)
|
Surface |
Sinkage, cm |
Coefficient of Rolling Resistance (R/N) |
|
Hard smooth roadway |
0 |
0.02 |
|
Firm dirt roadway |
slight |
0.035 |
|
Dirt roadway |
2.5-5 |
0.05 |
|
Rutted dirt roadway |
10-15 |
0.075 |
|
Soft muddy road or sand |
20 |
0.1-0.2 |
Generally, with the increase in tire diameter, the rolling resistance decreases in tilled loam soil or sand type soils. Tire inflation has also amarked effect on rolling energy requirements, depending on the type of surface upon which the tire travels. On soft surfaces such as loose sand or tilled loam, a higher inflation pressure results in an increased rolling resistance force. On the other hand, larger inflation pressures reduce the rolling resistance of a tire travelling on surfaces which are more firm such as sod or concrete.
A further factor which can influence the effort required to move wheels on soil is the arrangement of two or more wheels on a vehicle. Another set of experiments conducted by Mckibben and Davidson (1940) indicated that a different result is caused by placing the dual wheels, side by side or a tandem configuration in which one wheel follows the other (Table 8.2)
Table 8.2: Rolling resistance coefficient (R/N) of 15.2-40.6 cm tires in different arrangements under a vertical load N of 4.5 KN per tire and at an inflation pressure of 138 kPa (Mckibben and Davidson, 1940).
|
Tire arrangement |
Coefficient of rolling resistance (R/N) |
||
|
Bluegrass pasture |
Tilled loam |
Loose sand |
|
|
Single |
0.06 |
0.319 |
0.338 |
|
Dual, 20 cm center |
0.061 |
0.278 |
0.342 |
|
Dual. 30 cm center |
0.059 |
0.290 |
0.308 |
|
Dual, 40 cm center |
0.061 |
0.305 |
0.313 |
|
Tandem, following |
0.057 |
0.223 |
0.223 |
There was 26-32% reductions in rolling resistance coefficient for the second trial of a wheel in the same track on tilled loam and sand surfaces. While the reduction in motion resistance, resulting from tandem wheel arrangement and trailer wheels following tractor tires, may offer savings in machinery operation energy, there can be an offsetting price to pay elsewhere i.e. compaction of soil at about the same rate as does increased contact pressure on a single wheel.
It means that tandem wheels or a trailed machine in the same tracks, will double the soil compaction effect of each individual wheel under the same weight. If a machine has wheels arranged side by side, or a trailer has wheels in tracks to the side of tractor tracks, then less intensive compaction occurs in the soil, although admittedly a larger area of a field will be compacted.
i. Soft wheel on soft surface
Here the wheel (or a track) is assumed to impose a uniform pressure on the soil which deforms uniformly over the contact area as shown in Fig 8.3 until the contact area times the pressure at the tyre surface is equal to the weight on the tyre. This pressure may be assumed to be made up of the pressure equivalent to the stiffness of the tyre carcass and the internal pressure of the air (and the water if used).


Fig. 8.3: Sinkage and deflection for soft and hard wheel and on soft surface
Then the vertical work to press such a plate into the soil:
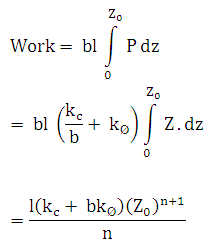
But for a weight, N on the plate, at maximum sinkage ,
 ...(8.11)
Before considering the two types of wheel / surface that have been analysed on this basis we need to show how the soil parameters can be measured.
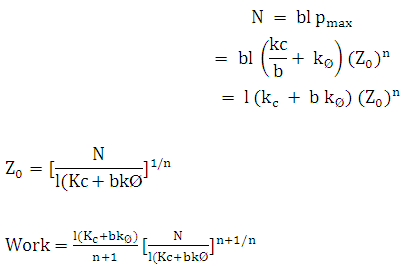
Consider the work done in towing such a wheel a distance, l against the rolling resistance, R. In simple terms, if this is equal to the work done on forming the rut as calculated for the plate, length l , width b pressed into the soil, as in (a) above:
 ... (8.12)
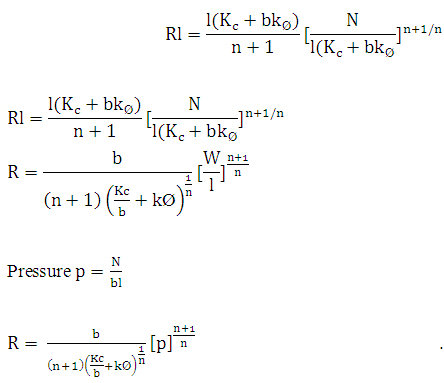
This simple analysis suggests that rolling resistance depends directly (but not necessarily proportionally) on the weight of the wheel W, and inversely (but not necessarily proportionally) on the length of the contact area l but not the diameter of the wheel except in so far as it affects l. It also depends in a complex way on the width of the contact area, b. For n = 1, which might be considered typical for an agricultural soil (Dwyer, 1984), this equation can be put in the form of a coefficient of rolling resistance:
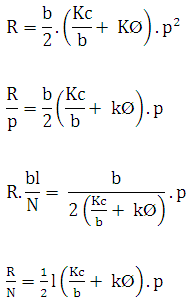 ...(8.13)
This equation suggests that the coefficient of rolling resistance will be proportional to the ground pressure and inversely proportional to the length of the contact area. Hence, for example, improved traction will be achieved on sandy soils if p is small and l is large, ie, by the use of low pressure tyres.
Another approach to develop a predictive formula for rolling resistance was proposed by Mckyes(1978). It was based on the assumptions that rolling resistance is proportional to the wheel load, the sinkage in the soil and the inverse of tire outside diameter, a component is added to account for tire deformation and resistance on hard surfaces, as follows
![]() ...(8.14)
...(8.14)
Where,
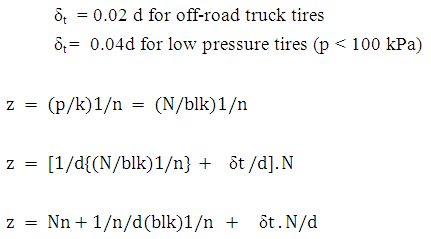
The first part of the above equation involving soil stiffness actually becomes identical to the above equation if
![]()
If on the other hand, the tire contact length l is assumed to be one half of the tire diameter, d then
l = d/2 (for soft surface like soil)
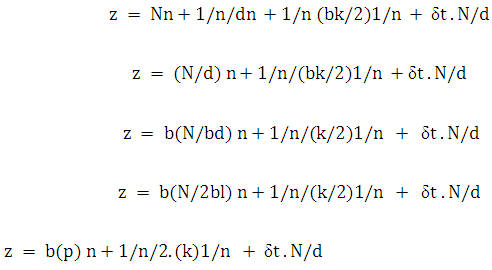 ... (8.15)
The equation shows that rolling resistance increases with normal force, soil stiffness (1/k) and width at constant contact pressure (p). Resistance also decreases with the tire diameter
Last modified: Saturday, 5 April 2014, 5:21 AM