Site pages
Current course
Participants
General
MODULE 1. Introduction to mechanics of tillage tools
MODULE 2. Engineering properties of soil, principl...
MODULE 3. Design of tillage tools, principles of s...
MODULE 4. Deign equation, Force analysis
MODULE 5. Application of dimensional analysis in s...
Module 6. Introduction to traction and mechanics, ...
Module 7. Traction model, traction improvement, tr...
Module 8.Soil compaction and plant growth, variabi...
LESSON 10. DESIGN OF TILLAGE TOOLS
10.1. Shape
The three design factors involved in the design of tillage tools are,
i. shape,
ii. manner of movement, and
iii. the initial soil condition.
Of the above three design factors, the designer has complete control only over shape. The user of a tillage tool may vary the manner of tool movement namely, the depth or speed of operation and may use the tool through a wide range of initial soil conditions. The shape of tillage tools, therefore, has received considerable emphasis since the ideal tillage tool should perform satisfactorily over wide ranges of soil conditions and depths and speeds of operation. Tool shape cannot be considered independently of its manner of movement or the initial soil condition. A description of tool shape must also be oriented with respect to the direction of travel of the tool, or its operating geometry will be ill defined. Likewise, different initial soil conditions sometimes require different shapes. This situation has resulted in the development of various configurations of moldboard plows for different soils and conditions. Since shape is the only design factor over which the designer has complete control, it must be given primary consideration in tool design.
When considering shape as a design factor, one of the first steps is to describe the shape of a tool. A description is required for the design equations as well as for construction purposes. Many tillage tools have complex shapes, and these shapes cannot easily be represented in mathematical form. Therefore, the shape description of a tool is almost exclusively restricted to the surface that comes in direct contact with the soil. Generally, no attempt is made to represent other surfaces of the tool mathematically, except when clearance is required to prevent undesirable contact with the soil.
A mathematical description of the shape of a tool is the most versatile means of representation. For some simple shapes, a plane adequately represents the surface; and the plane along with its orientation is relatively easy to describe mathematically. As more complex surfaces have evolved, however, standard mathematical equations often no longer represent the surfaces. Attempts have thus been made to find other ways to describe the complex shapes. These attempts often employed graphic representations of shapes that cannot easily be represented by mathematical equations. Some representations of tool shapes have been carried to the extreme so that the shape is described only by the pattern or mold used in its manufacture. The development of means to adequately describe the of tillage tools is still a major area of concern in the design of tillage tools.
A second step associated with shape as a design factor requires identification of the variables that represent the shape design factor. A third step is the establishment of the equations themselves. Unfortunately, these last two steps may have to be combined. To illustrate, the shape variables in the design equations should be the parameters that are identified by mathematical descriptions of shape. Probably, however, geometric parameters will not be independent of each other in the design equations. Any dependence must be represented in the functional relation and the design equations will not be simple. On the other hand, a transition equation might be developed in which the shape description parameters are combined to define new variables that will be independent in the design equations. With independent variables, the design equations should be simpler and easier to develop. Thus, identifying the variables and developing the equations may not be separate.
In essence they are separate, since independent variables could be identified; but the functional relations could be so complex that they could not be established. Describing the shape, identifying the shape variables in the design equations, and developing the equations themselves are the three elements involved with shape as a design factor.
10.1.1. Macroshape
The surface over which soil moves as a tillage tool is operated constitutes the shape that is of concern in design. Any finite surface has a boundary or edge whose “shape” is independent of the shape of the surface itself. A tillage tool is finite and has boundaries that are generally referred to as edges. The shape of edges in contact with soil affects the forces required for soil manipulation just as does the shape of the finite surface. Since the area of the edges of a tool is generally much smaller than the area of the surface itself, the term edgeshape is used to refer to the shape of edges while the term macroshape is used to designate and emphasize the shape of the gross surface.
The moldboard plow is perhaps the most widely used tillage tool today. Its ancestor is, of course, the forked stick. While its history is long, descriptions of the macrosurface of a moldboard plow did not receive much emphasis until metals were used to construct the plow. Even then, the first descriptions of the surface were developed so that the plow could be constructed. Very little emphasis was placed on determining a relation between force and shape or between soil condition and shape that could be used to evaluate designs.
Any emphasis that was placed on design resulted in information that could be utilized in equations 132 and 133 only in a qualitative sense ( 160 ) . The usefulness of descriptions of shape, however, does not hinge on their utilization in design equations, since the first requirement in shape design is a description.
One of the first methods for accurately describing the surface of a moldboard plow was developed by Thomas Jefferson in 1788 ( 199 ). It was a physical method that could be used for constructing a plow. A description was inherent in the method he proposed since it involved generating a surface with a rigid framework (fig. 145). The surface was generated by using lines e-m and o-h as directrixes and by moving a straight edge from g-e to m-h in such a manner that the straight edge remained and rotated within the vz plane. The surface generated by the straight edge as it moved was considered to be the surface that would invert the soil with the least possible resistance. Jefferson did not determine the mathematical description of the surface; he merely devised the framework and the method of its use to represent a plow surface.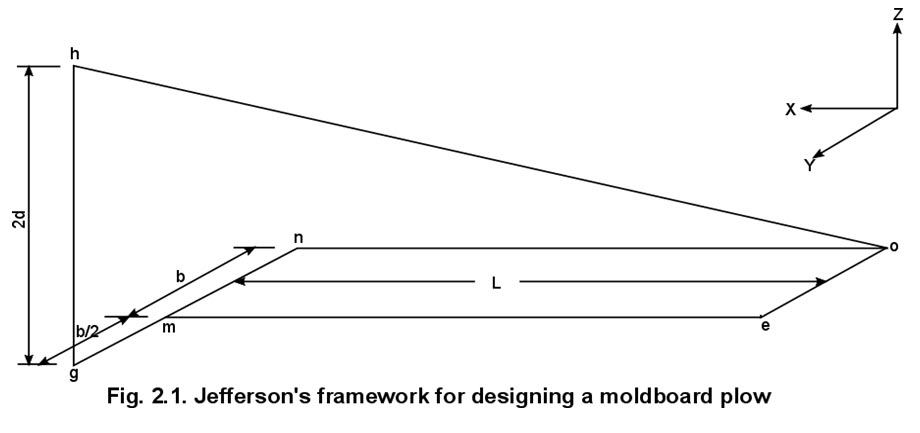
A number of models of this type of framework have been used in constructing moldboard plows. Whereas Jefferson used straight lines to represent both the generator (the moving line) and the directrixes (fixed lines), others have used catenaries, arcs of circles, cycloids, and helices. Never has the choice been based on more than intuition. The method does, however, provide a means of generating a vast number of different surfaces applicable to moldboard plows.
A mathematical analysis of a surface generated by this method can be made to determine an equation that describes the surface. White ( 502, 503 ) analyzed a number of plows, including the Jeffersonian plow. He established equations for the surface in a Cartesian coordinate system oriented as shown in figure 145. The surface equations were derived from the equations of three different lines that were passed through the surface. Upon a rotation of the reference coordinate system, the equations of the Jeffersonian plow could be reduced to those of hyperbolic paraboloids. White was able to obtain equations to describe other plow surfaces that were not hyperbolic paraboloids. He was unable, however, to relate these equations to either the forces or the resultant soil condition except in a general qualitative way. Nevertheless, his work is of merit because he demonstrated that an existing plow shape could be mathematically represented.
Graphical descriptions of shape have been used by various researchers including White ( 502, 503 ), Ashby ( 18, 19 ) and Krutikov and others ( 231 ). They used graphical methods both to describe the shape and to try to establish design equations. In one commonly used method for graphically determining macroshape, an apparatus similar to that shown in figure 146 is employed. The gridded plane on the right in figure 146 is used to position a measuring rod. The tool whose shape is to be described can be oriented so that the gridded plane represents a plane perpendicular to the direction of travel of the tool. If the gridded plane is a yz plane, the x and y axes are so oriented that the xy plane is a horizontal plane and the xz plane is a vertical plane; both contain the direction of travel. To describe the shape of a properly oriented tool, the distance x that the rod extends through the yz plane is recorded at each grid location in the yz plane. A two-dimensional graph can be made by plotting the x and y values at a constant z and by connecting the plotted points with a smooth curve. The curve represents the intersection of a horizontal plane and the surface being described. By superimposing a series of such contour lines in one plane and connecting the ends of the contour lines (the edges of the surface), a two-dimensional representation of the surface is constructed.
Last modified: Wednesday, 12 February 2014, 9:54 AM