Site pages
Current course
Participants
General
MODULE 1. Introduction to mechanics of tillage tools
MODULE 2. Engineering properties of soil, principl...
MODULE 3. Design of tillage tools, principles of s...
MODULE 4. Deign equation, Force analysis
MODULE 5. Application of dimensional analysis in s...
Module 6. Introduction to traction and mechanics, ...
Module 7. Traction model, traction improvement, tr...
Module 8.Soil compaction and plant growth, variabi...
LESSON 11. MOULD BOARD PLOW SURFACES
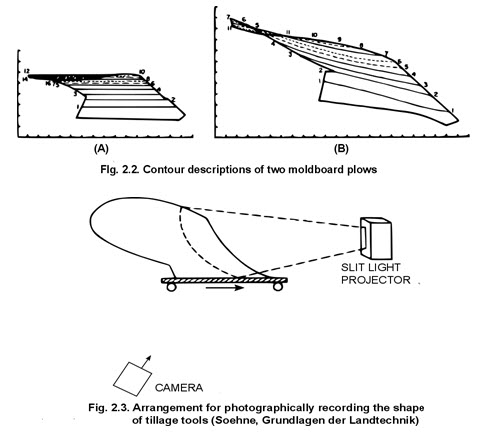
Representations of moldboard plow surfaces prepared by this method are shown in figure 147. Soehne ( 402, 403 ) used an optical means to expedite the preparation of descriptions by this procedure. He projected a slit of light onto moldboard plows that were painted white and recorded the reflected light trace photographically. The technique provides a rapid and accurate means of obtaining descriptions of shape (fig. 148). The slit of light could be projected either vertically or horizontally so that contours could be obtained in either direction. Accuracy was assured since both the projector and the camera were fixed and only the plow bottom moved. Soehne labeled the photograph contours alphabetically from the bottom to the top and from the front to the rear, as shown in figure 149. Contour representations of the type shown in figures 147 and 149 generally have not been mathematically described. They have been useful, however, for comparing shapes and for manufacturing purposes.
One of the first attempts to relate shape to newly created soil conditions (equation 133) was made by Ashby ( 19 ). He utilized graphical representations from which he defined parameters of the shape of plow bottoms. He attempted to correlate the shape paraobservations of plow performance. His measure of performance was primarily the covering of plant residues during actual plowing. Ashby defined a slope coefficient that was identified with the “full cut section” of a plow (fig. 150). This section is located in a vertical plane drawn perpendicular to the cutting edge of the share. The vertical plane is drawn to intersect the share at a distance from the furrow wall equal to the width of cut of the plow. The intersection of the plow surface and the vertical plane forms a curved line AB, which is used to define the slope coefficient. The curved line is shown in profile in figure 151, A along with its projected distances C, H, and X. Ashby defined the slope coefficient as follows :
![]()
Where, H = height of the plow,
X = projected width of the plow,
C = distance the top of moldboard departs from the vertical line tangent to the curved profile.
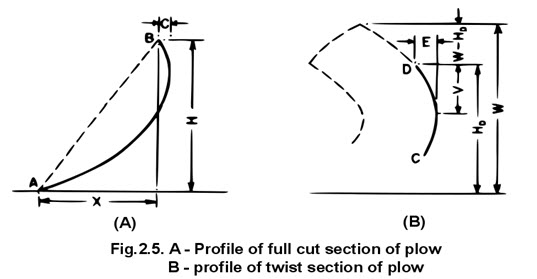
When the moldboard has considerable twist, the slope coefficient has to be modified by a correction factor. Another section of the plow, identified as the twist section DC in figure 150, lies parallel to the full cut section but is two-thirds of the distance from the full cut section to the wing tip. The profile of the twist section CD, shown in figure 151, B, was used to determine the slope coefficient correction factor. The correction factor was computed from the equation
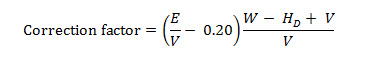
where W, V, E, and HD are distances identified in figure 151, B. The correction factor was applied only when the ratio E/V was greater than 0.20. The slope coefficient as modified by equation 139 thus becomes
![]()
Ashby used equation 140 to calculate the slope coefficient of a number of moldboard plows. The plows were operated in a series of field experiments during which the covering performance of the plows was judged according to a standardized rating system. A multiple correlation was made between the covering performance and the number of plow shape factors believed to affect the covering performance. The correlation resulted in the following equation:
![]()
Where, X = subjective rating of covering performance,
A = size of the plow,
B = horizontal clearance of the plow,
C = slope coefficient,
D = width of plow at waist,
E = relation of height to width of wing.
As the regression coefficient in equation 141 indicates, the slope coefficient C appears to be the most important factor considered. Ashby’s work illustrates one of the principles discussed in the empirical development of design equations. A parameter of the shape description is used as a variable in a design equation. Although this particular slope coefficient is probably a poor parameter and inadequately reflects the shape, it nevertheless is commendable as a first attempt. One hopes that more than covering can be included as a measure of the newly created soil condition. In addition, a quantitative description of the covering should be developed to replace the standardized rating system. Although equation 141 is inadequate and probably inaccurate in terms of design needs for today, its weakness should serve as an impetus to seek improvement.
In principle this rudimentary equation demonstrates that design equations can be developed.
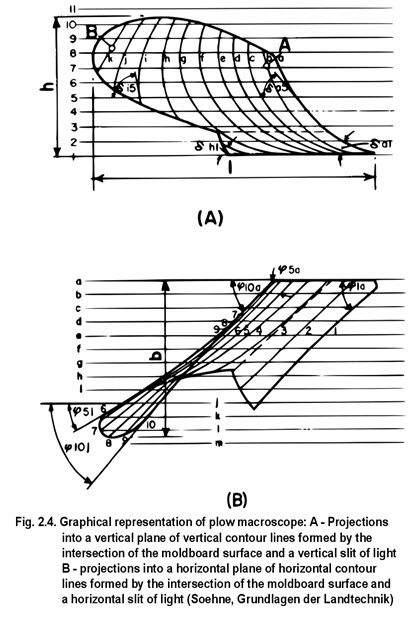
Soehne ( 402, 403 ) defined a number of parameters of shape descriptions and attempted to relate them to plow performance. He used the light slit technique to represent shape along grid lines l-11 and a-m, spaced 40 millimeters apart (fig. 149). And he selected the following angles as parameters :
Ø1a = share cutting angle,
Ø10a to Ø10j = lateral directional angle of the moldboard upper
Ø5a to Ø5i = lateral directional angle of the horizontal shape line 5 at the intersection with
vertical shape line a to i,
δal to δhl = share intersection angle at the vertical shape line a to h,
δa5 to δi5 = angle of the vertical shape line a to i along the horizontal shape line 5,
δA, δB = angle of the vertical shape line at A and B.
The performance of the plow was judged by draft resistance, and coverage and movement of the soil. He correlated the performances of 25 shapes with the list of parameters and concluded that certain parameters were important and had optimum values. Since he was considering high-speed plowing, the optimum values were for a speed of 9 kilometers per hour. The most important parameters and their optimum values are:
1. The best share intersection angle dal is about 15° to 17° at the share point and 8° to 10° at the share end.
2. The share cutting angle Ø1 should be about 35° to 38°.
3. The lateral directional angle Ø at a height of 160 to 200 millimeters (approximately elevation 5 in fig. 149, B) should be equal to the share cutting angle of the land side and should decrease toward the end of the moldboard to 23° to 27°; the horizontal shape lines must have a convex curvature.
4. A strong twist, as reflected by increasing values of d in the wing area i-j-k, is required for inversion at high speeds.
5. The upper edge of the moldboard should be raised higher toward the furrow side so that soil is not sprayed over it at high speeds.
Soehne’s parameters should not be considered as the ultimate parameters for describing a moldboard plow. While his optimum values are useful, they represent an initial qualitative approach to obtain design information. Quantitative values (the parameters) describe shape, but these values have not been related either to forces or to the resulting soil condition. Soehne has demonstrated, however, that more than one parameter of shape description can be obtained.
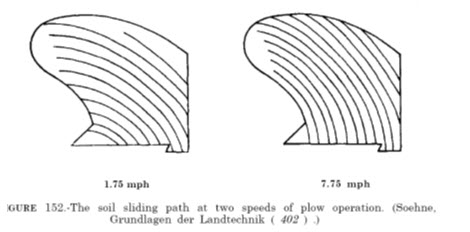
An indirect approach toward describing the macroshape of a plow, which is closely allied with the surface shape, has been used to develop design equations. In this approach, actual path of travel of soil over the macroshape surface is determined. One technique for determining the actual path is to paint a thin coat of lacquer on the tool surface prior to operation ( 84, 334, 402 ). Scratches on the surface made by the soil trace the path of travel. Figure 152 shows that the path of travel is straighter and steeper at 7.75 miles per hour than at 1.75 miles per hour.
The path of travel is related to the acceleration that is imparted to the soil; this, in turn, affects the acceleration force that contributes to draft. After examining a number of plows, Soehne concluded that so-called high-speed plows accelerated the soil less than did so-called standard-speed plows.
Carlson ( 60 ) reached the same conclusion from a study of two plow shapes in which he used a digital computer to calculate the acceleration characteristics of each shape. Even though the mathematical representation of acceleration is simple and fully developed, acceleration has not been quantitatively incorporated into design.
Nichols and Kummer ( 319 ) developed a tracing apparatus that could provide empirical equations to describe the path of soil movement over a moldboard plow (fig. 153). The principle of the apparatus was similar to that of Jefferson ( 199 ) ; he used a predetermined physical path along which to establish plow shape. The apparatus of Nichols and Kummer used the plow shape as the “directrix” to determine the orientation of the generator. Recall that Jefferson prescribed the orientation of the generator which thus swept out the shape.
The tracing method was based on the observation that most plow shapes represent a section of cylindrical surface. Therefore, a selected test arc may be fitted to the surface of a plow and swept across the plow along a hypothetical path of travel. As shown in figure 153, a measurement carriage rolling on guiding rails permits the test arc to be moved along the plow. At various increments of travel, which can also be considered to be units of time, the rotation angles and can be simultaneously measured. The variations in the vertical and horizontal rotation angles were plotted as functions of the carriage movement distance. The results combined Cartesian and polar coordinates into a single graphical system that could be used to compare different plow shapes. A mathematical expression for the functional relation provides a description of shape. Although mathematical characterization of the curves indicates differences between shapes, the characterization provides no rigorous information that can be utilized in plow design. In spite of this lack of design information, the device established a physical link between soil and plow because the path measured by the device and the actual paths of soil moved by the standard speed plows used at that time fortuitously coincided.
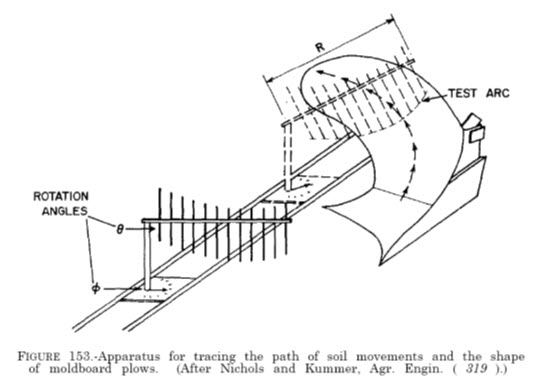
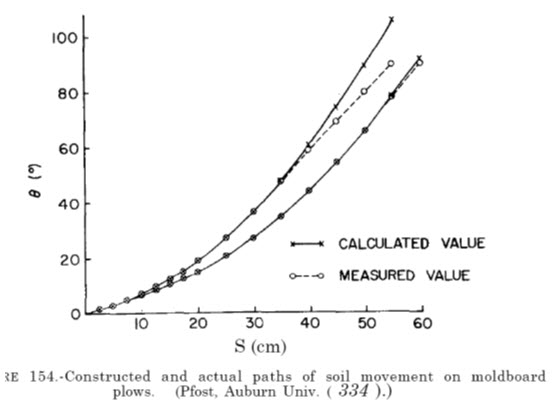
Pfost ( 334 ), using the same apparatus in a slightly different fashion, simplified the procedures. He described the path of only one point at a radial distance R (fig. 153), whereas the horizontal rotational angle was maintained perpendicular to the direction of travel Only the values of the inversion angle were recorded for each increment of S. As shown in figure 154, the constructed and the actual paths of soil travel for two plows agreed very well for one speed of plowing. Unfortunately, the speed at which the lines agree cannot be predicted, so that the usefulness of the method is limited to a descriptive role. Thus, while a description of actual path of soil travel is useful for calculating acceleration imparted to soil during movement over the surface, the description per se is no more useful for design purposes than a geometric description.
Regardless of the means by which macroshape is described, the description must ultimately be related quantitatively to forces and final soil conditions as implied by equations 132 and 133. Until such relations are effected, quantitative design information will have to originate from trial-and-error procedures.
Gross descriptions of shape, even though nondetailed, can be useful for design. Qualitative descriptions such as can be developed by the Jeffersonian technique have contributed greatly to the development of moldboard plows. The use of one such gross description was reported by Kaburaki and Kisu ( 205 ). Modifications made in the shape of moldboard-type plows have resulted in better scouring characteristics for Japanese conditions. These developments have led to an elliptical-shaped plow (fig. 155).
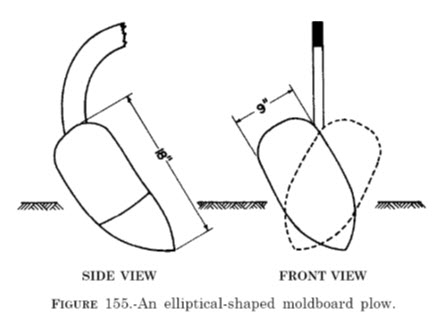
The exact nature of the superior frictional relations was not determined; but the tool had a smaller width of cut, which may have produced lower normal forces. Even though the design relations have not been established, the elliptical description permits a convenient shape characterization. Since the tool is symmetrical, it could also serve as a two-way plow, as shown in figure 155.
Last modified: Wednesday, 12 February 2014, 10:50 AM