Site pages
Current course
Participants
General
Module 1. Introduction to human engineering
Module 2. Human performance and responses
Module 3. Working environment and work space design
Module 4. Rehabilitation scheme and DMR Act
Topic 5
Topic 6
Topic 7
Topic 8
Topic 9
Topic 10
Lesson 4. INFORMATION INPUT PROCESSES
4.1 Information input process
“Information” is the transfer of energy that has meaningful implications in any given situation; e.g. a driver communicating with his tractor through displays and controls. The input to the operator is the information received through the sense organs. Our sensory mechanisms are sensitive to certain stimuli, which convey meaning to us. The stimuli are various forms of energy, such as light, sound, heat, and mechanical pressure. Information from the original source may be direct (e.g. a visual signal of undulated field), or indirect (e.g. quantity of fuel in tractor tank through fuel meter on display board, change in sound of tractor engine). The humans are continually bombarded with stimuli from our immediate environment, these stimuli consisting of various forms of energy to which our senses organs are sensitive. The interpretation of such stimuli (i.e. information they convey) is generally a function of our learned association. The processing of information include the sense which acts as primary input and gives signal to brain. The human perceptual sensors are (Table 1):
Table 1 Human sensors and associated input signals
|
Human sensors |
Associated input |
|
Eyes |
Visual input |
|
Ears |
Acoustic signals |
|
Skin |
Touch/ Warm |
|
Nose |
Smell |
|
Tongue |
Taste |
It is noticed that usually multiple senses operate at the same time. For example, driver of a tractor uses eyes, ears and skin or all of them at same time.
4.1.1 Information processing system
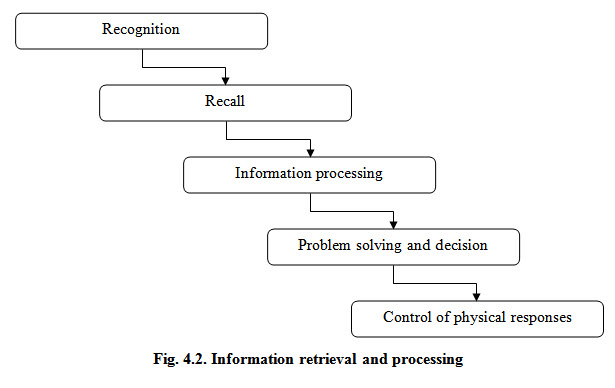
How humans perceive and process information must be taken into account in order to design interfaces that can be learned and used efficiently. In all human-system interactions, the user must perceive information, process information, and make decisions based on that information, leading to responses and actions. For example, the human eye receives visual information and codes information into electric-neural activity which is fed back to the brain where it is stored and decoded. This information can be used by other parts of the brain relating to mental activities such as memory, perception and attention
The output (i.e. behavior or action) might be, for example, to safely drive a tractor on the road.
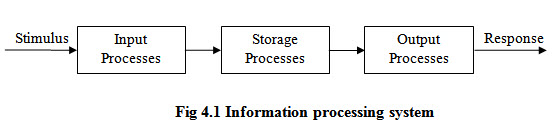
Information processing system consists of a series of stages, which represent stages of processing. Arrows indicate the flow of information from one stage to the next
Input processes are concerned with the analysis of the stimuli.
Storage processes cover everything that happens to stimuli internally in the brain and can include coding and manipulation of the stimuli. Information stored can be a short term or a long term memory.
Output processes are responsible for preparing an appropriate response to a stimulus.
4.1.2 Measurement of information
Information is measured in bits (binary unit). A bit is defined as the amount of information obtained from one of two equally likely alternatives specified. When various alternatives are equally probable, the amount of information is given by formula:
![]() -------- (1)
-------- (1)
Where, H is amount of information in bits, and n is number of equally probable alternatives.
If n is 2 then H is logarithm of 2 to the base 2, which is 1. For example, if there are four lights on a panel and only one of them may be on at a time, then we have two bits of information. Equation 1 can be written in terms of probability of each alternative, where probability is the reciprocal of n. Therefore;
![]() -------- (2)
-------- (2)
4.1.3 Stimulus characteristics
The stimulus inputs that human receive via any sensory modality (vision, audition etc.) differ in terms of their characteristics. For example, visual characteristics include shape, configuration, size, position, color, etc. The auditory characteristics include sound pressure level, frequency, duration, continuous/intermittent signal, etc.
4.1.4 Displays for information input
Displays can be either dynamic or static. Dynamic displays are continually changing or are subject to change with time, e.g. temperature or pressure gauge, fuel gauge, ampere meter, RPM meter, speedometer, monitors and displays, TV and radio signal, etc. Static displays remain fixed over time, e.g. signs, charts, graphs, labels etc. There is a need of presenting information to people by use of displays in such a manner so that usefulness of information under given conditions is enhanced affectively.
4.1.5 Information presented by displays
Major types of information presented by displays are described below.
Quantitative information: Such displays present quantitative value of some variable like temperature, pressure, speed, etc.
Qualitative information: Such displays provide approximate value, trend, rate or direction of change. E.g. ampere meter of chargeable battery, RPM meter showing approximate value, etc.
Status information: Such displays present condition or status of a system. E.g. ON-OFF indicators, stop-caution-go lights, indicator for reverse gear, warning indicators, battery status indicator, etc.
Warning and signal information: Such displays indicate emergency or unsafe conditions or absence of some object/ conditions. E.g. aircraft or lighthouse bacons, reverse light indicators, turning indicators, brake light indicators, signal for low/high beam light, seat belt signal, door open signal, fuel refill indicator, etc.
Representational information: Such displays provide pictorial or graphic representation of objects areas or other configurations. E.g. movies, photographs, maps, charts, diagrams, graphs, door open signal, seat belt indicator, heart beat shown on heart rate monitor, etc.
Identification information: Such displays are used to identify a particular condition, situation or object. E.g. sign boards on the roads, traffic lights, color coded signals, etc.
Alphanumeric and symbolic information: Such displays provide audible, numerical or related coded information. E.g. signs, labels, placards, instructions, music notes, printed and typed material including Braille, etc.
Time phased information: Such displays give pulsed for time phased signals. E.g. blinking lights, Morse code, intermittent beeps, etc.
4.1.6. Selection of sensory modality
Selection or designing of displays for transmission of required information plays very important role in certain situations. The decision may depend upon a number of considerations as given in Table 1.
Table 1. When to use the auditory or visual form of presentation
|
Use auditory presentation, if: |
Use visual presentation, if: |
|
The message is simple |
The message is complex |
|
The message is short |
The message is long |
|
The message is not be referred to later |
The message will be referred to later |
|
The message deals with events in time |
The message deals with location in space |
|
The message calls for immediate action |
The message does not call for immediate action |
|
The visual system of the person is overburdened |
The auditory system of the person is overburdened |
|
The receiving location is too bright or dark-adaption integrity is necessary |
The receiving location is too noisy |
|
The person’s job requires him to move about continually. |
The person’s job allow him to remain in one position |
Source: Sanders and McCormick (1993)
Suggested Readings:
Bridger R.S. 1995. Introduction to Ergonomics. Mc Hill Corporation, New York.
Matthews J. and Knight A.A.. 1971. Ergonomics in Agricultural Equipment Design. National Institute of Agricultural Engineering, Wrest Park, Silsoe, Bedford.
Salvendy G.1997. Handbook of Human Factors and Ergonomics. John Wiley and Sons, Inc.
Sanders M.S. and McCormick E. J. 1993. Human Factors in Engineering and Design. Mc Hill Corporation, New York.
Last modified: Friday, 31 January 2014, 11:11 AM