Site pages
Current course
Participants
General
Module 1. Introduction to human engineering
Module 2. Human performance and responses
Module 3. Working environment and work space design
Module 4. Rehabilitation scheme and DMR Act
Topic 5
Topic 6
Topic 7
Topic 8
Topic 9
Topic 10
Lesson 5. MAJOR TYPES AND USES OF DISPLAYS
5.1. Classification of displays
Displays provide useful and required information in a conveniently presentable form. Displays can be broadly classified under three categories:
-
Visual displays
-
Auditory displays
-
Tactual displays
5.1.1. Visual displays
They are the most common in use and involve visual capabilities and skills of users. The commonly used types of visual displays are discussed here.
5.1.1.1. Quantitative visual displays
These displays provide information about quantitative value and some variable, which may be a dynamic variable such as temperature or speed, or a static variable such as measurement of length with a ruler. Such displays have units written alongwith quantity of variable. There are three basic types of dynamic quantitative visual displays

Fixed scales with moving pointers
Moving scales with fixed pointers
Digital displays or counters
Fixed scale with moving pointer type displays are mostly preferred; however, for long scales displays having circular or tape type moving scales are preferred. Digital displays used if values remain long enough to read.
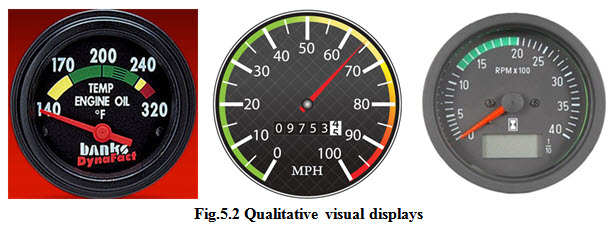
5.1.1.2. Qualitative visual displays
Such displays provide approximate value, trend, rate or direction of change. Quantitative data is used as a basis for qualitative reading in at least three different ways:
To convey information about status or condition of variable falling within limited number of predetermined ranges. E.g. temperature gauge to determine if engine whether engine is cold/ normal/hot
To maintain roughly a desirable range of values. E.g. speedometer showing range of speed between 0-50 mph for safer control.
To observe trends, rate of change, etc. E.g. engine RPM meter.
5.1.1.3. Status indicators
They provide approximate information as an indication of status of a system or component. E.g. temperatures gauge to dip it if the engine is cold/normal/hot. Other examples include ON/OFF indicator, traffic light on roads etc (Fig.5.3). If a quantitative instrument is to be used only for check-reading purpose, status indicator should be preferred.
5.1.1.4. Signal and warning lights
Flashing and steady state lights are used for various purposes viz. indications of lower/upper beams of lights, warning lights for low-battery, low-fuel, seat-belt not used, door-open, engine-oil level low, low brake-oil, hand-brake ON, reverse gear engaged, beacons, etc (Fig.5.4). Detection of signals and warning lights may depend upon size, luminance, color, background, exposure time, and flash rate.
5.1.1.5. Representational display
Representational displays may be pictorial i.e. intended to reproduce an object/scene or may be symbolic/illustrative. The purpose of such display is to convey a visual impression that requires little interpretation. For example: aircraft position display, GPS for road map, charts and graphs, etc (Fig. 5.5).
5.1.1.6. Alphanumeric and related displays
The effectiveness of such displays depends upon various factors like typography, content, selection of words, color, background, contrast, illumination, and writing styles. The typography of alphanumeric information includes stroke width, aspect ratio, font type, font size, spacing of characters, spacing between lines, margins, color, etc. The communication of message by such displays depends upon visibility, legibility, and readability (Fig. 5.6).
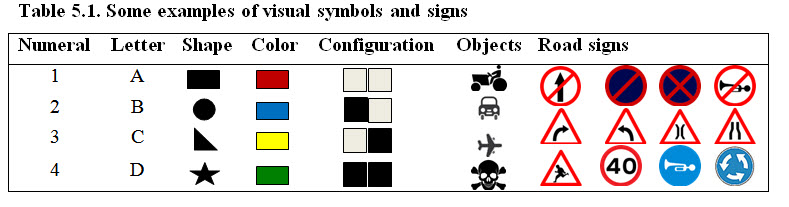
5.1.1.7. Visual codes symbol and signs
In our daily life we use a variety of visual codes symbols and signs which convey their intended meaning. They includes numerals, letters, geometrical shapes, colors, configurations, symbolic shapes representing various objects and messages (Table 5.1).
5. 2. Auditory displays:
The auditory displays involve sound as a signal. In a human-machine interface, the frequency and intensity/amplitude are two primary attributes of sound. In general, the human ear is sensitive to sound waves having frequency range between 20-20,000 Hertz (Hz). Intensity of sound or sound pressure level is generally measured in decibel (dB). A decibel is one-tenth of a bel (named after Alexander Graham Bell) and is expressed as a ratio on logarithmic scale. The Sound pressure level (SPL), measured in decibels, can be written as:
SPL = 20 log Po/Pr ------ (1)
Where, Po is root mean square (rms) acoustic pressure at point of consideration, and Pr is reference pressure (20 µPa).
Circumstances under which auditory displays are preferred:
When the origin of a signal itself is a sound.
When the message is simple and short.
When the message doesn’t need to be referred afterwards.
When the message deals with events in time.
When the message calls for immediate action.
When the visual display system is overloaded.
When illumination limits use of vision.
When the operator moves away from visual display.
The commonly used auditory displays are radio signals (dot-dash system) or warning and alarm signals. The commonly used devices for warning and alarm signals are horn, whistle, siren, bell, buzzer, chimes, etc.
5.3. Tactual display:
Tactual displays use cutaneous (skin or somesthetic) senses. Such displays utilize a qualitative or comparative sensation of thermal or mechanical or chemical or electrical stimulus. Thus its use is only to a very limited extent or under special conditions. Braille is particularly important for people who are visually impaired. The Braille display and textual maps are good examples of tactual displays. Another use of tactual senses control knobs. The coding of such devices for tactual identification includes their shape, texture and size. Vibrator of a cell phone that uses a mechanical stimulus is another example of our daily life.
Suggested Readings:
Bridger R.S. 1995. Introduction to Ergonomics. Mc Hill Corporation, New York.
Kroemer K.U.E. and Grandjean E. 2001. Fitting the Task to the Human: A textbook of Occupational Ergonomics. Taylor and Francis.
Salvendy G.1997. Handbook of Human Factors and Ergonomics. John Wiley and Sons, Inc.
Sanders M.S. and McCormick E. J. 1993. Human Factors in Engineering and Design. Mc Hill Corporation, New York.
Last modified: Friday, 31 January 2014, 11:38 AM