Site pages
Current course
Participants
General
Module 1_Fundamentals of GW
Module 2_Well Hydraulics
Module 3_Design, Installation and Maintenance of W...
Module 4_Groundwater Assessment and Management
Module 5_Principle, Design and Operation of Pumps
Module 6_Performance Characteristics, Selection an...
Keywords
12 April - 18 April
19 April - 25 April
26 April - 2 May
Lesson 28 Characteristic Curves of Centrifugal Pumps
28.1 Introduction
A pump is usually designed for one speed, flow rate and head, but in actual practice the operation may be at some other condition of head or flow rate, and for the changed conditions the behavior of the pump may be quite different. For instance, if the flow through the pump is less than the designed quantity, the magnitude of flow velocity through the impeller will be changed, thereby changing the head developed by the pump, and at the same time the losses will increase so that the efficiency of the pump will be lowered. Therefore, in order to predict the behavior and performance of a pump under varying conditions, pump tests are performed, and the results of the tests are plotted. The curves thus obtained are known as the ‘characteristics curves’ of the pump.
Most pump manufacturers have their own pump testing laboratories. They normally publish a set of characteristic curves for each pump model manufactured by them. These curves are developed by testing several pumps of a specific model. Some manufacturers’ curves represent the average performance of all pumps of a specific model tested, while other manufacturers prepare their curves for the pump having the poorest performance. In this lesson, firstly pump characteristics curves are defined and classified, and then different types of characteristics curves of centrifugal pumps are discussed.
28.2 Defining Pump Characteristic Curves
The pump characteristic curves can be defined as ‘the graphical representation of a particular pump’s behavior and performance under different operating conditions’.
The operating properties of a pump are established by the geometry and dimensions of the pump’s impeller and casing. Curves relating total head, efficiency, power, and net positive suction head required (NPSHR) to discharge or pump capacity (Q) are utilized to describe the operating properties (characteristics) of a pump. This set of four curves is known as the pump characteristic curves or pump performance curves.
28.3 Classification of Pump Characteristic Curves
Pump characteristics curves can be classified into four groups: (i) Main characteristic curves, (ii) Operating characteristic curves, (iii) Constant efficiency curves, and (iv) Constant head and constant discharge curves. Each group characterizes one aspect of the pump’s performance. They are described in subsequent sections.
28.3.1 Main Characteristic Curves
The pump is usually designed to run at the same speed as the driving unit (i.e., prime mover), which is generally an electric motor of the AC induction type. When the electric power is not available, the pump may be driven by a diesel engine, or may be coupled to the tractor engine. In such circumstances, it is necessary to know the performance of a pump at different speeds, which can be best seen from the main characteristic curves of a pump.
In order to obtain the main characteristic curves of a pump, it is operated at different speeds. For each speed, the pump discharge (Q) is varied by means of a delivery valve and for the different values of Q, the corresponding values of manometric head (Hm), shaft power (SP) and overall efficiency (ho) are measured or calculated. Thereafter, Hm vs Q; SP vs Q, and ho vs Q curves for different speeds are plotted as shown in Fig. 28.1, which represent the main characteristics of a pump. Clearly, these curves are useful in indicating the performance of a pump at different speeds.
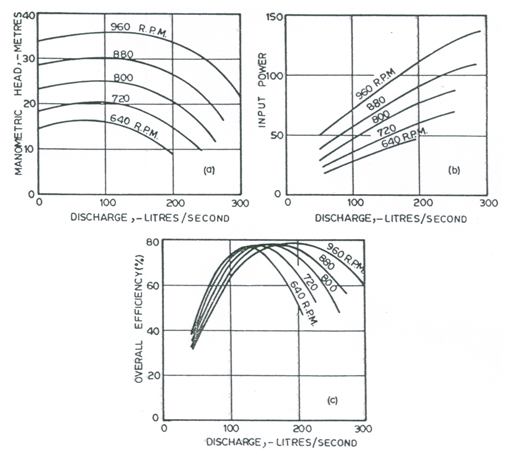
Fig. 28.1. Main characteristics curves of a centrifugal pump.
(Source: Modi and Seth, 1998)
28.3.2 Operating Characteristic Curves
During operation of a pump, the pump must run constantly with the speed of the prime mover; this constant speed is usually the design speed. The set of main characteristics curves which corresponds to the design speed is mostly used in pump operation, and hence such curves are known as the operating characteristics curves. A typical set of such characteristics of a centrifugal pump is shown in Fig. 28.2, which consists of four curves at a constant speed viz., head versus discharge (Hm vs Q) curve, efficiency versus discharge (ho vs Q) curve, power versus discharge (BP or SP vs Q) curve, and net positive suction head required versus discharge (NPSHR vs Q) curve. From these characteristic curves, it is possible to determine whether the pump will handle the necessary quantity of liquid against the desired head and what will happen if the head is increased or decreased. In addition, these characteristic curves illustrate what size motor will be required to operate the pump at the required conditions and whether or not the motor will be overloaded under any other operating conditions. A brief description of these curves is provided below.
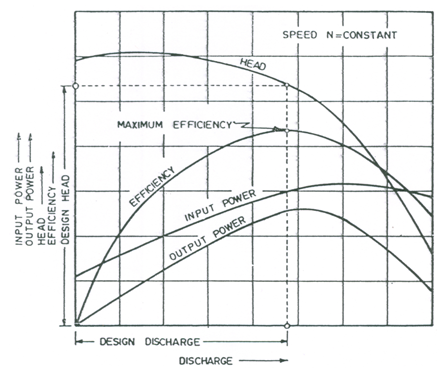
Fig. 28.2. Operating characteristic curves of a centrifugal pump.
(Source: Modi and Seth, 1998)
28.3.2.1 Head versus Discharge Curve
The head-discharge curve (H-Q curve) relates the head produced by a pump to the volume of water pumped per unit time (i.e., discharge of the pump). Generally, the head produced by a pump steadily decreases as the discharge of the pump increases (Fig. 28.2). The values of the head and the discharge corresponding to the maximum efficiency are known as the design head or normal head and the design discharge or normal discharge of a pump.
The shape of the H-Q curve varies with the specific speed. Typical H-Q curves for various specific speeds and impeller designs are shown in Fig. 28.3. For radial flow impellers, head decreases only slightly and then drops rapidly as discharge (Q) increases from zero. Slope changes along H-Q curves for the mixed and axial flow impellers are not as dramatic as those for radial flow impellers. Radial flow impellers operating on the flat portion of their H-Q curves work well in situations where head must remain essentially constant as Q fluctuates (e.g., as in set-move systems where the number of operating laterals varies during the irrigation season). In situations where a relatively constant Q is desired and H is expected to fluctuate (e.g., water sources like a well, small stream, or small reservoir), the impellers with higher specific speeds will probably perform the best.
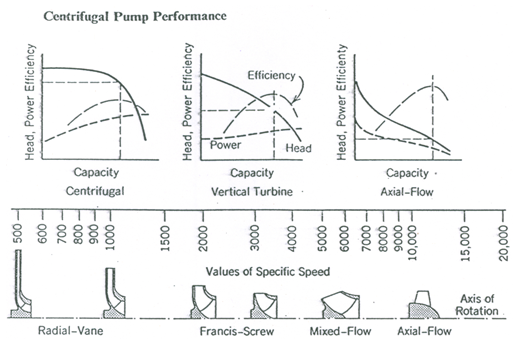
Fig. 28.3. Head-discharge curves as a function of specific speed and impeller design. (Source: James, 1988)
Moreover, the head generated by the pump when discharge is zero (i.e., when the pump is operating against a closed valve) is called shutoff head. For pumps with steadily declining H-Q curves, the shutoff head is the maximum head and must be known to design piping on the discharge-side of the pump. In such situations, discharge-side piping must be able to withstand the shutoff head when the discharge valve is closed. Note that the efficiency of a pump is zero at the shutoff head, since energy is used to turn the pump.
28.3.2.2 Efficiency versus Discharge Curve
The pump efficiency versus discharge (ho-Q) curves for typical centrifugal pumps are illustrated in Figs. 28.2 and 28.3. The overall efficiency (ho) for a pump gradually increases to a peak as Q increases from zero, and then it declines with further increase in Q. There is normally only one-peak efficiency for a given type of impeller.
The theoretical pump efficiency is a function of specific speed, impeller design, and pump discharge as shown in Fig. 28.4. This figure indicates that the larger capacity pumps can be expected to have the highest efficiency. The overall efficiency (ho) is also related to the types of materials used in construction, the finish on castings, the quality of machining, and the type and quality of bearings used. For example, impellers with extremely smooth surfaces tend to be more efficient than rougher surfaced impellers.
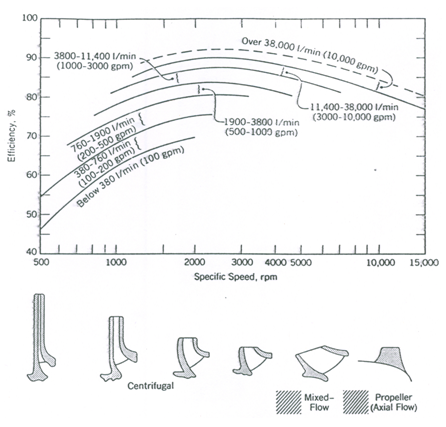
Fig. 28.4. Variation of theoretical pump efficiencies with specific speed, impeller design and discharge. (Source: James, 1988)
Furthermore, it should be noted that the efficiency versus discharge curve is usually for a specific number of stages. If a different number of stages are needed for a particular situation, efficiencies must be adjusted upward or downward depending on the number of stages. Manufacturers usually provide information for making these adjustments.
28.3.2.3 Power versus Discharge Curve
The brake power (BP) or shaft power (SP) versus discharge/capacity (Q) curve for a pump is derived from its H-Q and ho-Q curves. The shape of the BP-Q curve depends on the pump’s specific speed and impeller design. Figure 28.3 shows that for radial flow impellers, BP generally increases from a nonzero value to a peak and then decreases slightly as Q increases from zero. For mixed flow impellers, BP increases gradually from a nonzero value as Q increases. However, for axial flow impellers, BP is maximum when Q is zero and it steadily decreases as Q increases from zero. Thus, when axial flow pumps are started, the discharge-side valve (or discharge valve) should be open to the atmosphere in order to minimize the start-up load. In contrast, the discharge-side valve should be closed when radial flow and mixed flow pumps are started.
28.3.2.4 NPSHR versus Discharge Curve
The fourth characteristic curve typically published by pump manufactures is the net positive suction head required (NPSHR) versus pump discharge (Q) curve as shown in Fig. 28.5. It is evident from this figure that for a typical radial flow pump, NPSHR gradually increases as the pump discharge increases.
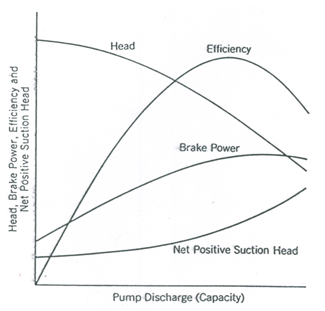
Fig. 28.5. NPSHR versus discharge curve. (Source: James, 1988)
28.3.3 Constant Efficiency Curves
The constant efficiency curves or Muschel curves (Fig. 28.6) help determine the range of pump operation for a particular efficiency. As shown in Fig. 28.6, the constant or iso-efficiency curves may be obtained from Hm vs Q and ho vs Q curves of main characteristic curves. In order to plot the iso-efficiency curves, horizontal lines representing constant efficiencies are drawn on the ho vs Q curves. The points at which these lines cut the efficiency curves at various speeds are transferred to the corresponding Hm vs Q curves. The points corresponding to the same efficiency are then joined by smooth curves, which represent the iso-efficiency curves or Muschel curves. From these curves, the line of maximum efficiency can be obtained (Fig. 28.6).
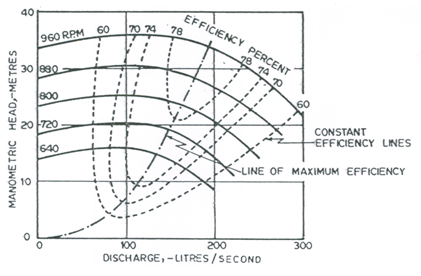
Fig. 28.6. Constant efficiency curves of a centrifugal pump.
(Source: Modi and Seth, 1998)
Thus, the Muschel curves facilitate the job of a salesman and enable the prospective customer to see directly the range of pump operation for a given efficiency. These curves further serve as a suitable basis for the comparison of pumps, especially from a commercial viewpoint.
28.3.4 Constant Head and Constant Discharge Curves
It is quite possible that a pump may be required to deliver water at a certain height, wherein head (H) is fixed. If for some reason, the pump speed (N) varies, the discharge of the pump will also be affected. In order to predetermine the performance of the pump under such conditions, it is necessary to draw a constant head curve by plotting Q versus N (Fig. 28.7). The constant head curve can be used to determine the speeds required to discharge varying amounts of water at a constant pressure head. Similarly, to determine the speeds required to discharge a certain quantity of water at different heads or to find variation of head with N, it is convenient to draw constant discharge curves by plotting H versus N (Fig. 28.7).
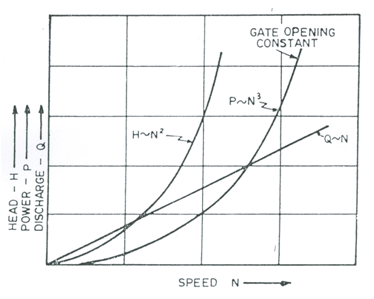
Fig. 28.7. Q versus N, Hm versus N, and P versus N curves of a centrifugal pump. (Source: Modi and Seth, 1998)
The constant head curves and the constant discharge curves are also useful for determining the performance of a variable speed pump having constantly varying speed.
References
-
James, L.G. (1988). Principles of Farm Irrigation System Design. John Wiley & Sons, New York.
-
Modi, P.N. and Seth S.M. (1998). Hydraulics and Fluid Mechanics. Twelfth Edition, Standard Book House, New Delhi.
Suggested Readings
-
Michael, A.M. and Khepar, S.D. (1999). Water Well and Pump Engineering. Tata McGraw-Hill Publishing Co. Ltd., New Delhi.
-
Murty, V.V.N. and Jha, M.K. (2011). Land and Water Management Engineering. Sixth Edition, Kalyani Publishers, Ludhiana.
-
Jensen, M.E. (Editor) (1980). Design and Operation of Farm Irrigation Systems. ASAE Monograph No. 3, ASAE, St. Joseph, Mi.
-
James, L.G. (1988). Principles of Farm Irrigation System Design. John Wiley & Sons, New York.
-
Stepanoff, A.J. (1994). Centrifugal and Axial Pumps: Theory, Design and Application. John Wiley & Sons, New York.
-
Lobanoff, V.S.L. and Ross, R.R. (1985). Centrifugal Pumps Design and Application. Gulf Publishing Co. Book Division, London.
Last modified: Friday, 14 March 2014, 11:58 AM