.jpg)
Site pages
Current course
Participants
General
Module 1: Formation of Gully and Ravine
Module 2: Hydrological Parameters Related to Soil ...
Module 3: Soil Erosion Processes and Estimation
Module 4: Vegetative and Structural Measures for E...
Keywords
Lesson 19 Measurement of Runoff and Sediment
19.1 Introduction
Uncontrolled soil erosion and the consequent silt deposition over downstream areas impacts many aspects of the environment- loss of fertile top soil, water quality, water supply, flood control, river regulation, reservoir lifespan, blocked natural groundwater recharge areas, irrigation, navigation, fishing, tourism, etc. It has attracted increasing attention from the public and engineers in the field. In this section, the main problems and issues related to river and reservoir sedimentation has been described to help the reader understand them better.
19.1.1Degree and Intensity of Soil Erosion
Soil loss tolerance
An evaluation of the seriousness of soil erosion needs to take into account the quantum of soil a given specific site is losing currently and the maximum permissible soil loss. Soil loss tolerance is the maximum rate of annual soil erosion that will not adversely affect the crop productivity to be obtained economically. The soil formation rate is an important factor in determining soil loss tolerance. Under natural conditions, the formation of about one cm soil may take anywhere between 50 to 150 years, while it takes about 100 years under farming conditions. This is based on the assumption that the parent rock has already undergone some weathering process towards formation of soil. An estimate puts the renewal rate at 1.25 tons per hectare per year for unconsolidated parent material, and much less for consolidated material. The formation of the weathering surface layer on a base rock of granite requires 10,000 to 100,000 years, while a base rock of non-granite needs much more time (Margan, 1980). So slow is the process of weathering that a person in his life time will not see a piece of rock changed into a mass of soil.
Soil erosion intensity
Soil erosion intensity means that under the action of natural agents and human activities, the soil is eroded due to denudation. The displacement per unit area and unit time is expressed by the soil erosion modulus. According to the Chinese Standard, erosion intensity is classified as given in Table 19.1
Table 19.1. Soil erosion intensity
|
Degree
|
Mean annual erosion modulus (t km–2 ha-1) |
Mean lost thickness (mm ha-1)
|
|
Slight Light Moderate Intensive Utterly intensive Severe |
< 500, 1250, 2500 500, 1250, 2500-6250 6250–12500 12500–20000 20000–37500 >37500 |
< 0.37, 0.92, 1.85 0.37, 0.92, 1.85–4.7 4.7–9.2 9.2–14.7 14.7–27.7 >27.7 |
(Source: http://whycos.org/IMG/pdf/948_E.pdf)
19.1.2Sediment Yield in a Basin
Water erosion is the most important type of erosion caused due to impact of rain drops and due to the flow of runoff. Its further importance under a monsoon climate, as occurs over India, is due to the sharp showers and copious runoff that follows the rainfall. In the entire process of erosion and transport; soil erosion, soil loss and sediment yield in a basin are three different but closely related concepts. Sediment yield is defined as the total sediment outflow from a watershed or drainage basin, measurable at a cross-section of reference in a specified period of time (Piest and Miller, 1975). In the comprehensive planning of a medium or small watershed, if the gross erosion and sediment delivery ratio are known, the sediment yield can be predicted.
Sediment observations are important baseline information for the optimal use of the water resources, for the protection against harmful impacts of the sediment as well as for the protection of the water and the environment. For that reason various types of sediment data are needed.
Table 19.2. An overview of necessary sediment observations
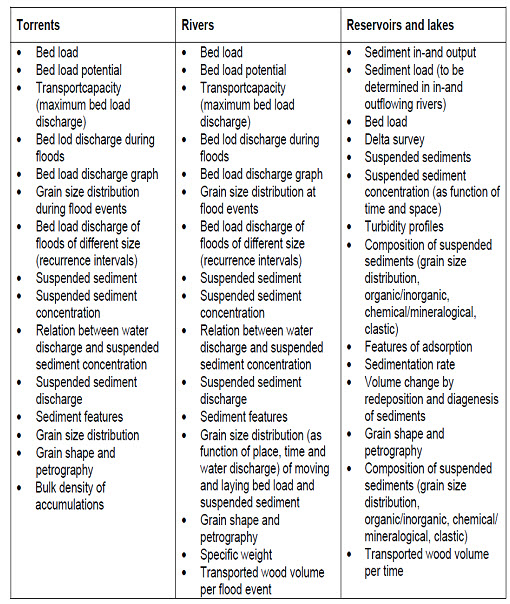
(Source: http://www.irtces.org/zt/11isrs/paper/Manfred_Spreafico.pdf)
Sediment load may be classified as suspended load or bed load according to the mode of movement in the river. Suspended load is the sediment that moves in suspension in water under the influence of turbulence. Bed load is the part of sediment load that moves in almost continuous contact with the stream bed by saltation and traction. That is, by bouncing, sliding and rolling on or near the stream bed by the force of water. According to its origin, or source of supply, the total amount of sediment transported in rivers may be divided into two parts: wash load and bed material load. Wash load consists of fine particles, which refers generally to sediment size finer than 0.062 mm, and the amount depends mainly upon supply from the source area. The discharge of bed material is controlled by the transport capacity of the stream, which depends upon bed composition and the relevant hydraulic parameters. Wash load moves entirely in suspension, while the bed material load may move either as temporarily suspended load or as bed load. Suspended sediment load is easier to measure and is mostly used in estimating catchment soil loss, reservoir sedimentation, etc. Despite a large number of studies, the bed load movement mechanism is not well understood and is either neglected or some tentative value is assumed for estimating total sediment flow passed a section or from a watershed.
19.2 Sediment Sampler
Sediment samplers are used to collect sediment-laden water sample from a flowing water body (river, tributary, canal, etc.). The sample is subjected to laboratory analysis to determine mainly the sediment content and also the chemical, physical, toxicological and biological composition of sediment. Samplers are also used to collect scoops or cores of soil from a known silt deposition site (e.g., reservoir bottom, flood plain) to gather historical information. Choosing the most appropriate sampling device and technique depends on the:
1) Purpose of sampling;
2) Location of sediment; and
3) Characteristics of sediment.
Sample Types:
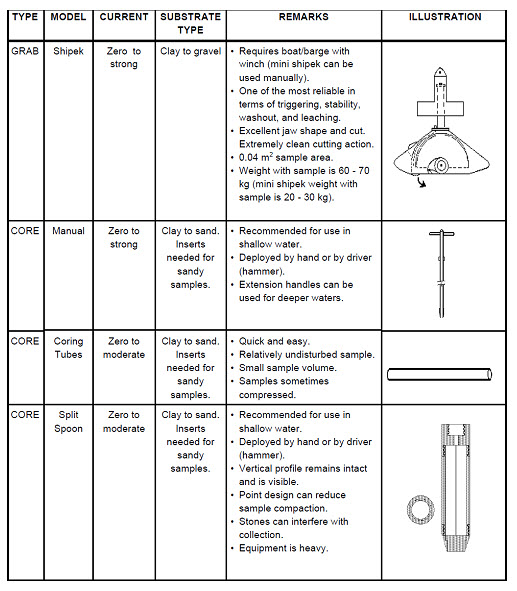
A description and rationale for the types of samples to be collected should be included in the plan. Different types of sampler are illustrated in Table 19.3 and Fig. 19.1.
Cores: Vertical discrete grab samples. Most appropriate for historical contamination information or dredging decisions at heavily contaminated areas.
Cores: Depth integrated composite samples. Most appropriate for reference and Section 404/401 issues.
Scoops and Dredges: Surface (top two to four centimeters) sediment grab samples. Most appropriate for benthic, sediment oxygen demand (in-situ), recent ambient conditions and recent contaminant investigation.
Surface sediment composite samplers: It may be used to reduce costs for specific conditions/situations such as some Section 404/401 issues or ambient or specific historical data. In general, however, discrete sampling is preferred if resources are available. An example of a discrete sample would be taking a section of one centimeter of sediment from a core sample that was originally one meter long.
Table 19.3. Table of Sediment Sampling Equipment
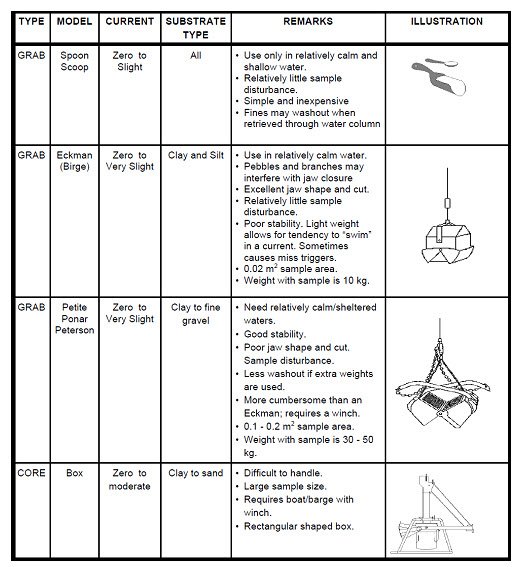
(Source: http://www.epa.ohio.gov/portals/35/guidance/sedman2012.pdf)
(Source: http://www.epa.ohio.gov/portals/35/guidance/sedman2012.pdf)
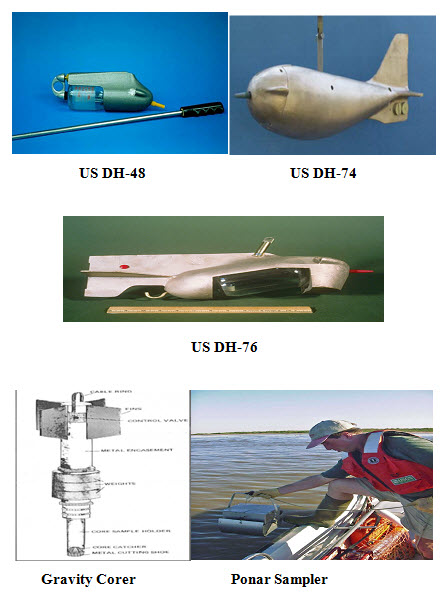
Fig. 19.1. Silt sampler. (Image source: http://www.glc.org/tributary/documents/sedimentcourse/buffalo/D104MonitoringForSed_Zajd.pdf)
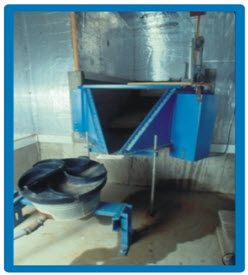
Fig. 19.2 Coshocton wheel water sampler (source: http://ars.usda.gov/Research/docs.htm?docid=10027)
19.3 Discharge Proportionate Samplers
Flow measurement data are required for information on the rates, volumes and frequencies of waste discharges to the wastewater system. The measured trade waste volume is used together with sample analysis results to calculate the masses of pollutants discharged. The flow data gathered is used to:
• Determine mass (trade wastewater) and volume (sewer usage) charges accurately
• Determine a discharge factor
• Provide the customer with discharge data, so that they can manage their trade wastewater discharge more effectively
• Enable flow proportional sampling of the trade wastewater
• Provide hydraulic data to assess the future capacity of the wastewater system.
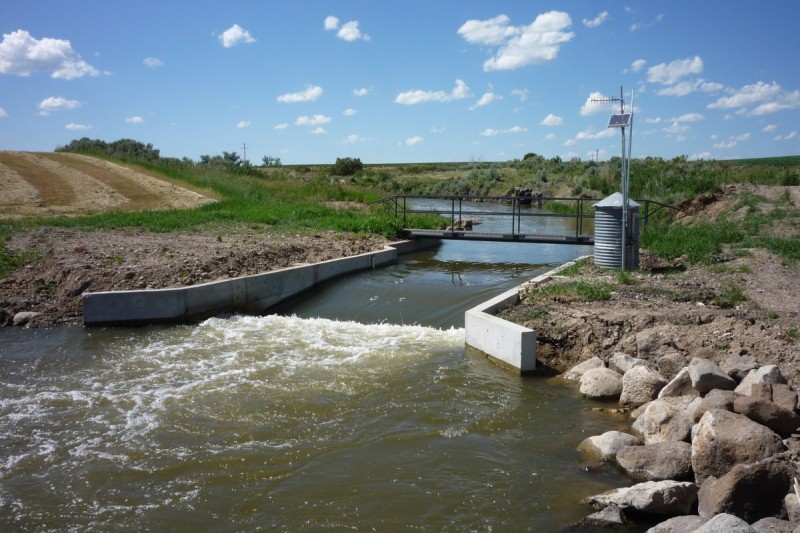
Different types of instrument used for measurement of flow velocity are illustrated in Figs. 19.3 to 19.7. Instruments for measurement of discharge like weirs and flumes are illustrated in Fig. 19.8 to 19.12.
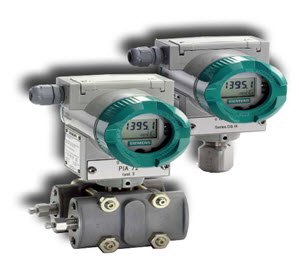
Fig.19.3. Magnetic flow meter. (Source: http://gallery.usgs.gov/images/07_20_2009/nsj7MYx43F_07_20_2009/large/000458-Current_Meter_(4).jpg)
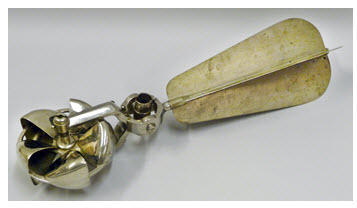
Fig. 19.4. Current meter. (Source: http://gallery.usgs.gov/images/07_20_2009/nsj7MYx43F_07_20_2009/large/000458-Current_Meter_(4).jpg)

Fig. 19.5. Horizontal float type recorder. (Source: http://ecx.imagesamazon.com/images/I/61srCwKjQyL._AA1500_.jpg)
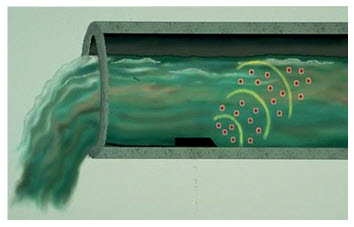
Fig. 19.6. Area velocity continuous wave Doppler (CWD).
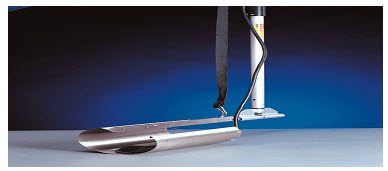
Fig. 19.7. Area velocity sensor mounting hardware.
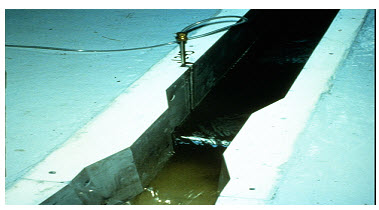
Fig. 19.8. Parshall flume.
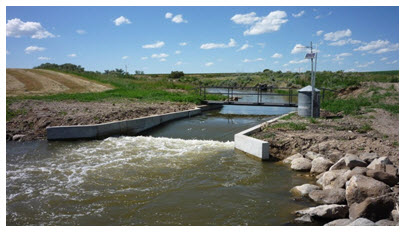
Fig. 19.8. Replogle flume or long-throated flume. (Source: http://inmtn.com/images/flumes/bench-b-ramp-flume.jpg)
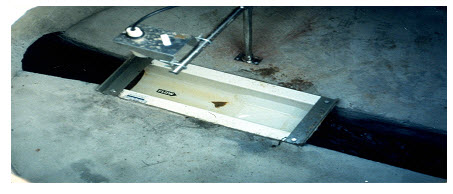
Fig. 19.9. Palmer BowlusFlume.
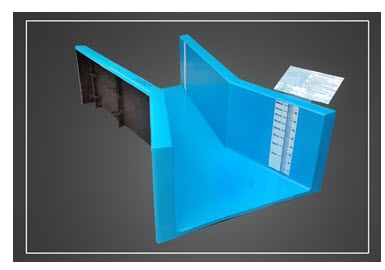
Fig. 19.10. Cut throat flume. (Source: http://www.niplastindia.com/Ni-Plast/cut-throat-flume-gallary.aspx)
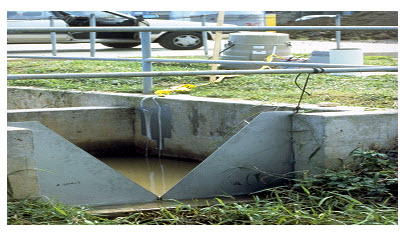
Fig. 19.11. V-Notch Weir.
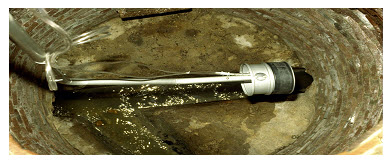
Fig. 19.12. Flow Metering Insert (Weir).
Water Level Measurement
These instruments are used to measure the depth of water level from the ground surface. The instruments are illustrated in Figures 19.13 to 19.16.
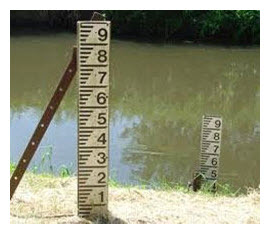
Fig. 19.13. Staff gauge. (Source; http://www.indiamart.com/sourcebusinesssyndicate/river-gauges.html)
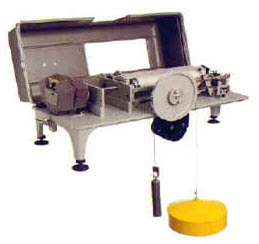
Fig. 19.14. US type A-71 water level recorder. (Source: http://www.rickly.com/sm/Float-Type/WaterLevelRecorders.htm)
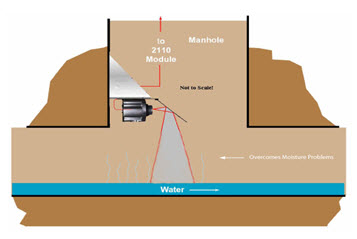
Fig. 19.15. Ultrasonic level measurement.
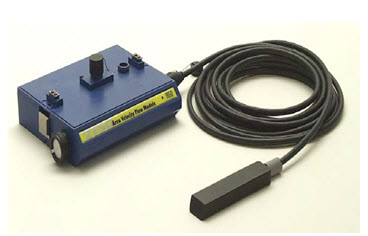
Fig. 19.16. Submerged probe / Pressure transducer. (Source: http://www.mi-wea.org/docs/Hummel%20 %20IPP%20Flow%20Paced%20Strategies.pdf)
Last modified: Monday, 23 September 2013, 6:00 AM