Site pages
Current course
Participants
General
Module 1:Water Resources Utilization& Irrigati...
Module 2:Measurement of Irrigation Water
Module 3: Irrigation Water Conveyance Systems
Module 4: Land Grading Survey and Design
Module 5: Soil –Water – Atmosphere Plants Intera...
Module 6: Surface Irrigation Methods
Module 7: Pressurized Irrigation
Module 8: Economic Evaluation of Irrigation Projec...
Topic 9
LESSON 21 Soil Water
21.1 Introduction
Soil-water-plant relationship relates to the properties of soil and plant that affect the movement, retention and use of water. Due to inadequate and/or uneven distribution of rainfall during the cropping season, it becomes necessary to apply additional water to the soil for plant use in the form of irrigation. Therefore, proper understanding of the soil-water-plant relationship is a prerequisite for the sound design of any efficient irrigation system.
21.1.1 Soil
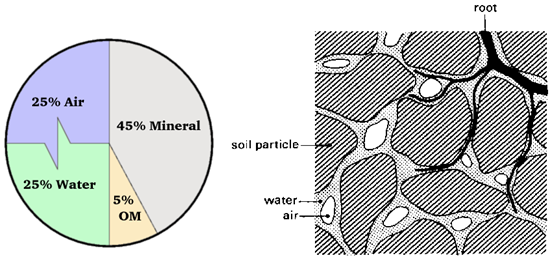
Fig.21.1.Volume composition & sectional view of soil.
(Source: http://www.fao.org/docrep/r4082e/r4082e03.htm accessed on May 26, 2013)
A soil matrix consists of solid, liquid and gaseous phases (Fig 21.1). The solid phase is the soil matrix comprising mineral, organic matter and various chemical compounds. The liquid phase contains all the dissolved substances. Liquid phase also referred by the soil moisture or soil water or soil solution. The gaseous portion of the soil consists of soil air and it occupies those spaces between the soils particles which are not filled with water (Fig 21.1).
In a completely dry soil, all of the pore spaces (i.e., space between soil particles) are filled with air, and in a completely wet soil all of the pores are filled with water. However, in most of the field situations the pore spaces are filled with both air and water. Finally, soil water and air vary in composition, both in time and space.
21.1.2 Soil texture
It refers to the relative proportion of sand, silt and clay in a given soil. Various combinations of sand silt and clay are used to classify soil according to its texture (Table 21.1).
Table 21.1. Common textural classes found in the field
|
Common names of soils (General texture) |
Sand |
Silt |
Clay |
Textural class |
|
Sandy soils (Coarse texture) |
86-100 |
0-14 |
0-10 |
Sand |
|
|
70-86 |
0-30 |
0-15 |
Loamy sand |
|
Loamy soils (Moderately coarse texture) |
50-70 |
0-50 |
0-20 |
Sandy loam |
|
Loamy soils (Medium texture) |
23-52 |
28-50 |
7-27 |
Loam |
|
|
20-50 |
74-88 |
0-27 |
Silty loam |
|
|
0-20 |
88-100 |
0-12 |
Silt |
|
Loamy soils (Moderately fine texture) |
20-45 |
15-52 |
27-40 |
Clay loam |
|
|
45-80 |
0-28 |
20-35 |
Sandy clay loam |
|
|
0-20 |
40-73 |
27-40 |
Silty clay loam |
|
Clayey soils (Fine texture) |
45-65 |
0-20 |
35-55 |
Sandy clay |
|
0-20 |
40-60 |
40-60 |
Silty clay |
|
|
0-45 |
0-40 |
40-100 |
Clay |
(Source:FAO: accessed on May 26, 2013)
The textural class of a soil can be accurately determined in the laboratory by mechanical analyses. Fig. 21.2 show various textural classes and is used to identify soil textural class based on information on Percent sand, silt and clay fraction in soil sample. Sand, silt and clay are size groupings of soil particles as shown below in Table 21.2:
Table 21.2. Size groupings of soil particles
|
Name of soil separate |
Diameter limits (mm) (USDA classification) |
|
Clay |
less than 0.002 |
|
Silt |
0.002–0.05 |
|
Very fine sand |
0.05–0.10 |
|
Fine sand |
0.10–0.25 |
|
Medium sand |
0.25–0.50 |
|
Coarse sand |
0.50–1.00 |
|
Very coarse sand |
1.00–2.00 |
(Source: http://en.wikipedia.org/wiki/Soil_texture: accessed on May 26, 2013)
Water holding capacity, permeability and infiltration rate of soil depends on the texture. For example, fine textured soils (clayey soils) have relatively higher water holding capacity, but the permeability for water and air is slow resulting in poor drainage and hence water logging. On the other hand, coarse textured soils (sandy soils) have very low water holding capacity and hence rapid drainage takes place. Therefore, crops grown on these soils require frequent irrigations in smaller amounts. Considering its various effects, the loamy soils are ideal for growing most crops under irrigated conditions.
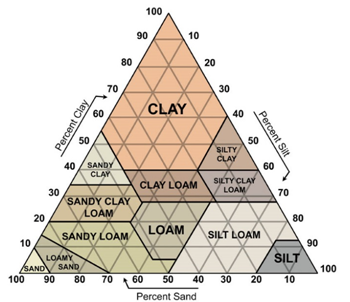
Fig. 21.2.Textural soil classes.
(Source:http://www.infohow.org/science/geology-environment-weather/soil-triangle: accessed on May 22, 2013)
21.1.3 Soil Structure
The structure of a soil refers to the arrangement of the individual soil particles with respect to each other and the formation of aggregates within the soil mass (Fig. 21.3). Soil structure has important role in water movement, plant root penetration, air movement etc.
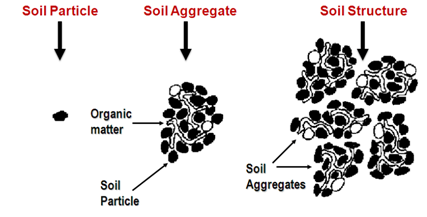
Fig. 21.3. Soil structure. (Source: Rao, et al., 2010)
The dominant shape of soil aggregates in a horizon determines their structural type, and it include speroidal (granular or crumbly subtypes), platy; prism like (columnar or prismatic subtypes) and block like (cube and sub-angular subtypes) (Fig. 21.4). The soil structure primarily influences root penetration and proliferation, total porosity and permeability of air and water.
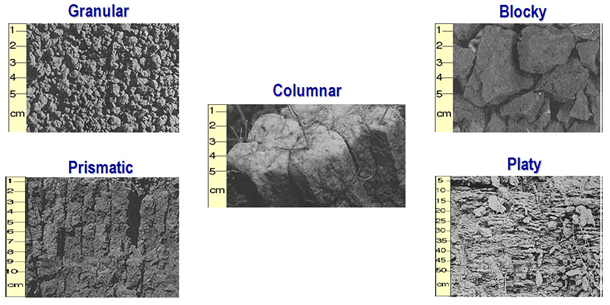
Fig. 21.4. Soil structural types. (Source: Rao, et al., 2010)
21.2 Soil Water Relations
As we discussed earlier the basic components of the soil consists of solid mineral particles, organic matter, the voids among the particles and water and air occupying the voids. Fig. 21.5 shows a schematic representation of the soil in relative proportions both in masses and volumes. The physical properties of the soil, including its ability to store water, are highly related to the fraction of the bulk soil volume that is filled with water and air. For plant growth and development to be normal, a balance of water and air in the pore space must be attained. If water is limited, plant growth may be inhibited by water stress. If air (aeration) is limited, usually by too much water, then growth may be limited by insufficient aeration.
The relationship between the three phases of soil can be described in a number of mathematical relationships. These relationships can be used to calculate one soil property from another.
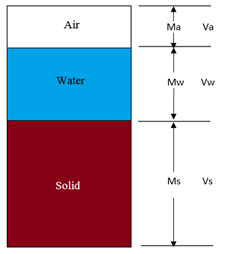
Fig. 21.5. Three phases of soil.
Referring to Fig. 21.5 the following notations are used:
Va = Volume of air
Vw = Volume of water
Vs = Volume of solids
Vv = Volume of voids (Va+Vw)
Vt = Total Volume (Va+Vw+Vs)
Ma = Mass of air (negligible)
Mw = Mass of water
Ms = Mass of solids
Mt = Total mass (Ma+Mw+Ms)
21.2.1 Particle density (ρs)
It is the ratio of a given mass (or weight) of soil solids to that of its volume and it is given by
![]() (21.1)
(21.1)
Sometimes it is referred to as true density. It is usually expressed in terms of g/cm3 and varies between the narrow limits of 2.6 to 2.75 g/ cm3. Particle density is a constant for a soil with a given texture and is independent of size and arrangement of the soil particles.
21.2.2 Dry Bulk Density (ρb)
It is the density of the undisturbed (bulk) soil sample which is the ratio of dry mass of the soil to its total volume. It is given by
![]() (21.2)
(21.2)
This is expressed as gm/cm3.Drybulk density can be calculated by collecting a known volume of soil to get the soil volume (Vt), and drying the associated soil to get the mass of dry soil (Ms).
21.2.3 Total (Wet) Bulk Density (ρ)
It is the mass of moist soil per unit volume and is represented as:
![]() (21.3)
(21.3)
Bulk density has a pronounced effect on the soil properties like permeability of soil for water and air, and penetration of plant roots through the soil. Compression or compaction of soil particles can increases bulk density but it reduces the soil porosity and in turn the soil water storage capacity. The bulk density values for different soil textural classes are given in Table 21.3.
Table 21.3. Bulk density values of various soil types (USDA - SCS)
|
Soiltexture |
Bulkdensity(g/cm3) |
|
1. Sandy |
1.60–1.70 |
|
2. Loamysand |
1.60–1.70 |
|
3. Sandyloam |
1.55–1.65 |
|
4. Finesandyloam |
1.50–1.60 |
|
5. Loamysoil |
1.45–1.55 |
|
6. Siltyloam |
1.40–1.50 |
|
7. Siltyclayloam |
1.35–1.45 |
|
8. Sandyclayloam |
1.40–1.50 |
|
9. Clayloam |
1.30–1.50 |
|
10.Claysoil |
1.25–1.35 |
|
(Source:Rao, et. al (2010))
|
Example 21.1:
Calculate the dry bulk density from the following data
Fresh weight of soil = 2505g; Weight of water = 740g; Height of core = 10cm;
Diameter of the core = 12cm
Solution:
Volume of the core = ![]()
DryBulkdensity = ![]()
21.2.4 Porosity ( )
Porosity is the void space in a given volume of soil that is occupied by air and water. The total porosity is calculated as follows:
![]() (21.3)
(21.3)
![]() (21.4)
(21.4)
Generally total porosity varies from 30% to 60% for agricultural soils. Coarse textured soils are normally less porous (35%– 50%) than the fine textured soils (40% – 60%). However, the mean size of individual pores is greater (>0.06mm in diameter) in the coarse textured soils than the fine textured soils.From irrigation water management point of view, knowledge of porosity in a given volume of soil is very important, because it is an index of moisture storage capacity and the aeration conditions. These are two most important factors that influence the plant growth.
Example 21.2
Calculate the porosity from the following data
Bulk density = 1.31 g/ cm3and particle density = 2.64 g /cm3.
Solution:
Porosity ( n ) = ![]()
21.2.5 Void Ratio (e)
It is the ratio of the pore space to the volume of solids and is given by
![]() (21.5)
(21.5)
21.2.6 Soil Water Content
The mass water content or soil moisture content(θm) is the ratio of the mass of water in a sample to the dry soil mass, expressed as either a decimal fraction or as percentage. It is often referred to as ‘gravimetric water content’. The mass water content is found by
![]() (21.6)
(21.6)
It is determined by weighing the soil sample collected from field, drying the sample for at least 24 hours at 105 0C, and then weighing the dry soil. Difference in mass of the wet and dry sample represents the mass of water in the soil sample (Mw). The mass of the sample after drying represents the mass of dry soil (Ms).
The volumetric water content ( ) represents the volume of water contained in total volume of undisturbed soil. The volumetric water content is defined as
![]() (21.7)
(21.7)
Determination of volumetric water content requires the volume of the undisturbed soil sample which is sometimes difficult to measure.However, it can also be determined from mass water content and specific gravity (ratio of bulk density of soil to density of water) as follows
![]() (21.8)
(21.8)
Where,
Pw= density of water which is 1 g/cm3
When comparing water amounts per unit of land area, it is frequently more convenient to speak in equivalent depths of water rather than water content. The relationship between volumetric water content and the equivalent depth of water in a soil layer is:
d = Θ v . L (21.9)
Where,
d = equivalent depth of water in a soil layer and
L = depth increment of the soil layer.
Example 21.3
A field soil sample prior to being disturbed has a volume of 82 cm3. The sample weighed 125 grams. After drying at 1050C for 24 hours, the dry soil sample weighs 100 grams. What is the mass water content? What is the volumetric water content? What depth of water must be applied to increase the volumetric water content of the top 1m of soil to 0.40?
Given: Ms = 100 g
Mw = 125 g - 100 g = 25 g
Vt= 82 cm3
Find: Θm, Θv and d
Solution:
![]()
Dry bulk density=![]()
Θv = Θm = ![]() of soil.
of soil.
The current depth of water in 1 m of soil is: d = Θv . L = 0.3025 1 = 0.3025 m.
The depth of water in 1 m of soil when Θv = 0.40 will be
d = Θv . L = 0.4 X 1 = 0.4 m.
Thus, the depth of water to be added is 0.0975 m (0.4m -0.3025m).
21.3 Kinds of Soil Water
Water present in the soil is referred to as the soil moisture. It is divided into three categories viz., gravitational water, capillary water and hygroscopic water (Fig. 21.6).
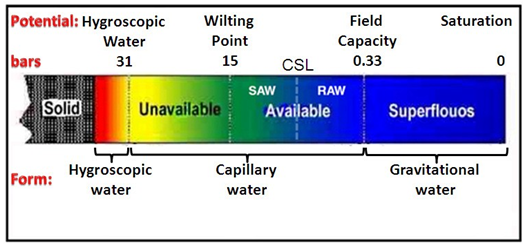
Fig. 21.6. Physical classification of soil water.
(Source : Rao et. al 2010)
21.3.1 Gravitational Water
Water held between 0.0 to 0.33 bars (0 to −33 kPa) soil moisture tension, that moves downward freely under the influence of gravity to the water table is termed as gravitational water (Fig. 21.). It is also referred to as free water. Gravitational water is of no use to plants as it drains out due to gravity. It reduces aeration in the soil and hence, its removal from soil is necessary for optimum plant growth.
21.3.2 Capillary Water
Capillary water is the water held in the capillary pores (micro pores). Capillary water is retained on the soil particles by surface forces, adhesion i.e., attraction of water molecules for soil particles, cohesion i.e., attraction between water molecules and surface tension phenomena. Adhesion is a process of the attraction of solid surface for water molecules and forms a very thin film of water at solid-liquid interface. On the other hand, cohesion is attraction of water molecules for each other. Capillary water is held between tension of about 0.33 bars (−33 kPa or 1/3 atmosphere, moisture content at field capacity) to 31 bars (−3100 kPa or 31 atmosphere, hygroscopic coefficient) as shown in Fig. 21.7. However, the water within the capillary range is not equally available i.e., it is readily available starting from 0.33 bars up to a certain point often referred to as critical soil moisture and thereafter up to 15 bars (−1500 kPa) it is available in lesser amounts. Further below, the water is held very tightly in thin films and is practically not available for plant use between 15 bars and 31 bars tension.
21.3.3 Hygroscopic Water
It is the water held tightly to the surface of soil particles by adsorption forces. Hygroscopic water is held tightly in thin films of 4 – 5 milli microns thickness on the surface of soil colloidal particles at 31 bars tension (−3100 kPa) and above (Fig. 21.7). It is essentially non-liquid and moves primarily in the vapour form. This water is unavailable to the plants as huge pressure force would be needed to extract it.
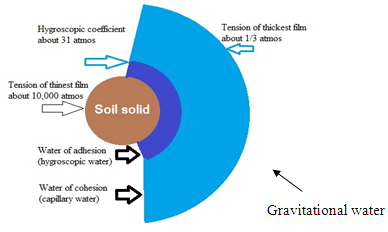
Fig. 21.7. Diagrammatic representation of different types of water.
(Source: Irrigation principles and management, University of Nebraska)
References
Michael, A.M. (2008). Irrigation Theory and Practice. Vikas Publishing House Pvt Ltd. New Delhi.
Murty, V.V.N. (2002). Land and Water Management Engineering (Fourth Edition). Kalyani Publisher, New Delhi.
Internet References
ftp://ftp.wcc.nrcs.usda.gov/wntsc/waterMgt/irrigation/NEH15/ch1.pdf
lawr.ucdavis.edu/classes/ssc107/SSC107Syllabus/chapter2-00.pdf
http://storm.okstate.edu/bae3313/Lecture/8)%20soilwaterplant%20relationships/soil-water-plant%20relationships.pdf
http://www.angrau.ac.in/media/7380/agro201.pdf
http://gilley.tamu.edu/BAEN464/Handout%20Items/Cuenca%20Book%20Chapter%203%20Soil%20Physics.pdf
http://ilri.org/InfoServ/Webpub/fulldocs/IWMI_IPMSmodules/Module_3.pdf
Suggested Reading:
http://www.fao.org/docrep/r4082e/r4082e03.htm
ftp://ftp.wcc.nrcs.usda.gov/wntsc/waterMgt/irrigation/NEH15/ch1.pdf
lawr.ucdavis.edu/classes/ssc107/SSC107Syllabus/chapter2-00.pdf
Rao,V.P., Suneetha, K.B. and Hemalatha,S. (2010). Water Management.AcharyaN.G. Ranga Agricultural Universtiy
http://www2.nau.edu/~doetqp-p/courses/env320/lectures.htm
Last modified: Saturday, 15 March 2014, 6:10 AM