Site pages
Current course
Participants
General
Module 1: Introduction and Concepts of Remote Sensing
Module 2: Sensors, Platforms and Tracking System
Module 3: Fundamentals of Aerial Photography
Module 4: Digital Image Processing
Module 5: Microwave and Radar System
Module 6: Geographic Information Systems (GIS)
Module 7: Data Models and Structures
Module 8: Map Projections and Datum
Module 9: Operations on Spatial Data
Module 10: Fundamentals of Global Positioning System
Module 11: Applications of Remote Sensing for Eart...
Lesson 29 Agriculture and Forestry
29.1 Crop Type Mapping
Crop type identification and mapping has a number of important aspects. It can serve for production statistics together with yield prediction, mapping soil productivity, assessment of crop damage and monitoring of farming activities. These include identifying the crop types (winter and spring cereals, rapeseed, sugar beet, potato, maize, grass, etc.) and delineating their parcel extent. Crop type identification is often based on multitemporal, multispectral high resolution imageries, while parcel boundaries delineation is more often based on very-high resolution imageries.
Remote sensing offers an efficient means of collecting the information, in order to map crop type and acreage. Remote sensing can also provide state information about the health of the vegetation. The spectral reflections vary with respect to changes in the phenology and crop health. This can be measured and monitored by multispectral sensors.
Crop type identification and mapping is based on use of multitemporal imagery to enhance the classification by taking into account changes in reflectance as a function of plant phenology. This in turn requires calibrated sensors and frequent repeat imaging throughout the vegetation season (source: www.gisat.cz/content/en/applications/agriculture; Feb. 12, 2013).
Hyperspectral remote sensing has also helped enhance more detailed analysis of crop classification. Thenkabail et al. (2004) performed rigorous analysis of hyperspectral sensors (from 400 nm to 2500 nm) for crop classification based on data mining techniques consisting of principal components analysis, lambda–lambda models, stepwise Discriminant Analysis and derivative greenness vegetation indices. Hyperspectral sensors images the earth surfaces in hundreds of narrow spaced contiguous bands, from which the spectral signature curves of different objects can be obtained. Spectral signatures are the specific combination of emitted, reflected or absorbed electromagnetic radiation (EM) at varying wavelengths which can uniquely identify an object. These unique spectral signatures of different crops help in their discrimination in the hyperspectral imagery, which can be obtained in multispectral imagery also like Landsat data, but a relatively low accuracy. In comparison to Landsat Enhanced Thematic Mapper data and other broadband sensors, these hyperspectral approaches increased accuracy for crop type mapping (refer Fig. 29.1).
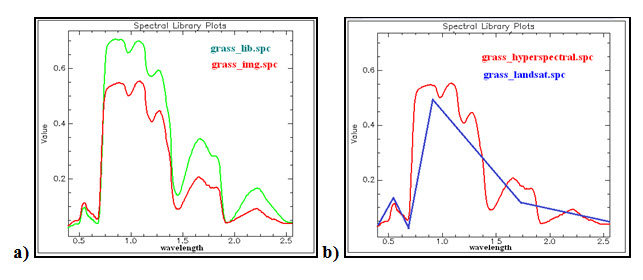
Fig. 29.1. Comparison of spectral signature curve a) between library spectra (green) and hyperspectral image spectra (red), b) between hyperspectral image spectra (red), Landsat image spectra (blue).
From the Fig. 29.1. it can be easily inferred that the hyperspectral satellite image data is more suitable than multispectral data for crop type mapping. An classified image is given below showing different crop types identified and mapped.
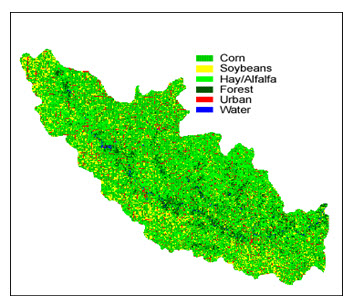
Fig. 29.2. Land cover/land use map of the Maquoketa River watershed for 1995.
(Source: www.umesc.usgs.gov/reports_publications/psrs/psr_1997_11.html)
29.2 Crop Monitoring and Damage Assessment
Assessment of the health of a crop, as well as early detection of crop infestations, is critical in ensuring good agricultural productivity. Stress associated with, for example, moisture deficiencies, insects, fungal and weed infestations, must be detected early enough to provide an opportunity for the farmer to mitigate. This process requires that remote sensing imagery be provided on a frequent basis (at a minimum, weekly) and be delivered to the agriculture planner quickly, usually within 2 days.
Remote sensing has a number of attributes that lend themselves to monitoring the crop health. One advantage of optical (VIR) remote sensing is that it can see beyond the visible wavelengths into the infrared, where wavelengths are highly sensitive to crop vigour as well as crop stress and crop damage. Remote sensing imagery also gives the required spatial overview of the land. Remote sensing can aid in identifying crops affected by conditions that are too dry or wet, affected by insect, weed or fungal infestations or weather related damage. Images can be obtained throughout the growing season to not only detect problems, but also to monitor the success of the treatment.
Healthy vegetation contains large quantities of chlorophyll, the substance that gives most vegetation its distinctive green colour. In referring to healthy crops, reflectance in the blue and red parts of the spectrum is low since chlorophyll absorbs this energy. In contrast, reflectance in the green and near-infrared spectral regions is high. Stressed or damaged crops experience a decrease in chlorophyll content and changes to the internal leaf structure. The reduction in chlorophyll content results in a decrease in reflectance in the green region and internal leaf damage results in a decrease in near-infrared reflectance. These reductions in green and infrared reflectance provide early detection of crop stress.
(http://www.nrcan.gc.ca/earth-sciences/geography-boundary/remote sensing/fundamentals/1696; date: 19th Feb., 2013).
In case of multispectral data, examining the ratio of reflected infrared to red wavelengths is an excellent measure of vegetation health. The normalized difference vegetation index (NDVI), vegetation condition index (VCI), leaf area index (LAI), General yield unified reference index (GYURI), and temperature crop index (TCI) are all examples of indices uses the multispectral data, used for mapping and monitoring drought and assessment of vegetation health and productivity. An example is the difference between irrigated crops and non-irrigated land is shown in Fig 29.3, in the true color image green areas are cultivated land and grey colored areas are waste lands or lands with very less vegetation. In a FCC (False Color Composite) image, where infrared reflectance is displayed in red, the healthy vegetation appears bright red, while the rangeland remains quite low in reflectance. Healthy plants have a high NDVI value (bright in Fig. 29.3. c)) because of their high reflectance of infrared light, and relatively low reflectance of red light. Phenology and vigour are the main factors in affecting NDVI.
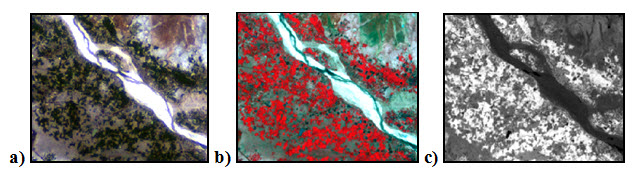
Fig. 29.3. a) True colored image of an area, b) standard false colored image of the same area, c) NDVI output image of the same area.
In case of hyperspectral remote sensing in crop monitoring, there will be change in the spectral profile of the crops (Fig. 29.4).
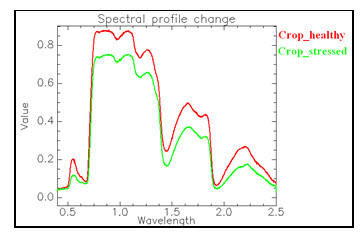
Fig. 29.4 Change in spectral profile of crop due to infection in crop.
Remote sensing doesn't replace the field work performed by the agriculture planner to monitor their fields, but it does direct them or provide enough information for the areas in need of immediate attention.
Fig. 29.5 provides scenario of an area before and after long time drought condition.
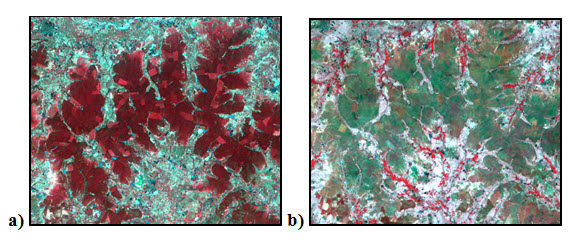
Fig. 29.5. a) Before incidence of drought, b) just after occurrence of drought.
29.3 Mapping of Forest Resources and Species Identification
The utility of the remote sensing data for forest type, canopy density mapping and monitoring on various scales is well established. Multispectral data such as that from IRS LISS-4 with 5.8m, IKONOS with 1m, and QuickBird with 0.61m spatial resolutions and hyperspectral data such as hyperion with 242 spectral resolutions provides an unprecedented opportunity to identify and monitor forest. Barring single species dominated forests and forest plantations, majority of the Indian forests are highly heterogeneous. This makes their differentiation, delineation and mapping a difficult task. Problem gets further compounded in case of forests that are located in hilly and mountainous regions on account of topographic effects.
Although passive satellite sensors offer routine and repeated assessments at very high spatial and spectral resolution, but this technology has difficulty in capturing reflectance beyond upper canopy layers and is better suited for mapping horizontal structure rather than vertical structure. In humid tropical areas, forest resource assessments and measurements are difficult to obtain because of cloudy conditions hindering conventional remote sensing efforts, and difficult terrain impeding ground surveys. Active remote sensing technologies offer great potential to spatially map a forest three-dimensional (3D) structure at various scales from landscape, stand and individual tree levels. Active satellite systems based on interferometric synthetic aperture radar (InSAR) can provide measures of horizontal and vertical structure of vegetation at regional scales, but this technology does not provide the spatial resolution required in detailed forest studies. However, LIDAR (Light Detection and Ranging System) data provides improved capabilities for the estimation of forest canopy dimensions at the individual tree level.
Table 29.1 Indexing algorithms for forest mapping using multispectral remote sensing data
|
Vegetation index |
Formulae (source) |
|
Simple Ratio (SR) |
= NIR / R |
|
Normalized Difference Vegetation Index (NDVI) |
= NIR - R / NIR + R |
|
Soil Adjusted Vegetation Index (SAVI) |
= (1 + L) * (NIR - R) / (NIR + R + L) L = correction factor, its value is dependent on the vegetation cover. |
|
Atmospherically Resistant Vegetation Index (ARVI) |
= (NIR - R) / (NIR + QRB), QRB = R - γ (B - R), γ = 1 (calibration factor) (Kaufman and Tanré 1992) |
|
Modified Soil Adjusted MSAVI |
= (1 + L) * (NIR - R) / (NIR + R + L) Vegetation Index L = 1 - 2a * NDVI * WDVI (Qi et al. 1994) |
|
Enhanced Vegetation Index (EVI) |
= G * (NIR - R) / (NIR + C1*R - C2*B + L) G = 2.5, C1 = 6, C2 = 7.5, L = 1 (Liu and Huete 1995) |
|
Modified Simple Ratio MR |
= (NIR / R - 1) / ((NIR / R)1/2+1) (Chen 1996) |
(Source: cdn.intechopen.com/pdfs/30811/InTech-Using_remotely_sensed _imagery_ for_forest_resource_assessment_and_inventory.pdf)
Where, R, NIR and B are red, near-infrared, and blue bands, respectively. For Modified Soil Adjusted Vegetation Index, WDVI = NIR - aR (a = 0.08, slope of the soil line). For Enhanced Vegetation Index, G, C1, C2 and L are coefficients to correct for aerosol scattering, absorption, and background brightness.
Hyperspectral imageries provide a very high spectral resolution which can be used to generate signatures of vegetation species and certain stresses (e.g. infestations) on trees. Hyperspectral data offers a unique view of the forest cover, available only through remote sensing technology. An output map generated from hyperspectral data is given in Fig. 29.6.
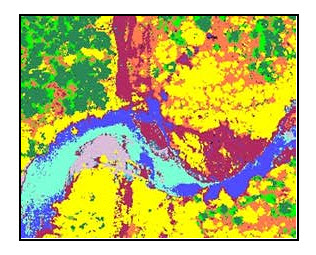
Fig. 29.6. Output classified map using hyperspectral data, where: Dark green: conifers, Green: lower branches, Light purple: gravel, Yellow: deciduous, Orange: dry ground cover, Red: wet ground cover, Blue (light): water, Blue (dark): deep or clear water
(Source: www.nrcan.gc.ca/earth-sciences/geography-boundary/remote-sensing/fundamentals/1258)
29.4 Forest Fire Mapping
Land and forest degradation process is considered to be one of the major environmental problems, which has lead to a variety of environmental disasters that adversely affect human life. Traditional land use practices and changes in weather patterns have affected the incidence of fires over a period of time. In tropical deciduous forests, fire is a natural factor due to high levels of water stress during summer. Frequent occurrence of fire is one of the reasons for the degradation of forests in India also. Annual fires may decrease the growth of the grasses, shrubs and forests, which may result in increased soil erosion.
Fire is the most spectacular natural disturbance that affects the forest ecosystem composition and diversity. Fire has a devastating effect on the landscape and its impact is felt at every level of the ecosystem. Majority of induced fires in the Indian forests are mainly caused for timber harvesting, land conversion, agriculture, cattle grazing, fodder and creating access to forest interiors. Fires set on farmlands, to clear agricultural residues, sometimes spread into the forests.
Satellite remote sensing provides the only practical means of monitoring and acquiring information about the spatial distribution of fire scars and fire activity. Understanding the behavior of forest fires, the factors that contribute to making an environment fire prone and the factors that influence fire behavior is essential for forest fire risk zone mapping.
(Source: www.jeb.co.in/journal_issues/201011_nov10/paper_13.pdf).
The severity of a burn for post-fire ecological effects can be assessed using some indexing method over satellite image data, such as normalized difference vegetation index (NDVI), composite burn index (CBI) and differenced Normalized Burn Ratio (dNBR) etc. The algorithms of these indexes are as follows:
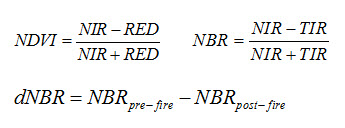
NIR-Near Infrared band & RED- Red band of a multispectral data set.
Geographical Information System (GIS) along with satellite remote sensing imageries aid more accuracy in forest fire detection, monitoring, assessing the forest fire risk zone mapping and management.
Flowchart (Fig 29.7) for preparing a forest risk map is shown below taken from a study reported for Bhadra Wildlife Sanctuary, Karnataka.
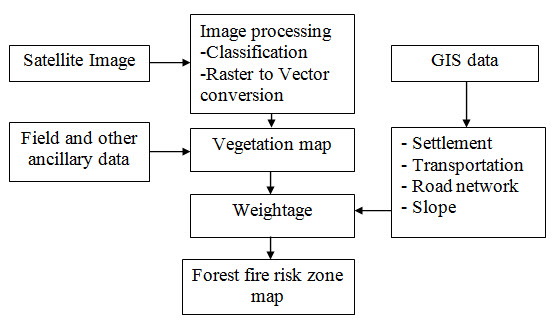
Fig. 29.7. Flow chart of the procedure followed for preparing forest risk map in Bhadra Wildlife Sanctuary, Karnataka
(Source: www.jeb.co.in/journal_issues/201011_nov10/paper_13.pdf)
One change detection process can also be used to show the change of forest cover before and after of a forest fire hazard. Depending on the purpose different kinds of procedure can be taken to get satisfied output results. Satellite image interpretation of a forest during fire hazard can be used to monitor real time situation, and will help the disaster management personnel to take necessary action in this regard.
Fig. 29.8 shows the burnt and unburnt areas generated from bNBR data.
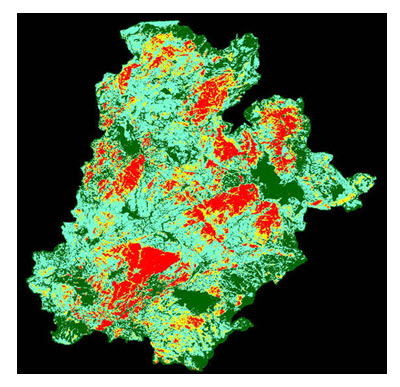
Fig. 29.8. The image generated from the dNBR data. The green colors indicate unburned or very lightly burnt areas; red areas illustrate highly burnt land. Credit: US Forest Service, Remote Sensing Applications Center (RSAC)
(Source: www.nasa.gov/mission_pages/fires/main/post-fire2011.html)
Keywords: Crop type mapping, Hyperspectral data, Spectral signature, NDVI, LAI, SAVI.
References
Chen, J.M., 1996, Evaluation of vegetation indices and a modified simple ratio for boreal applications. Canadian Journal of Remote Sensing, 22, 229-242.
Kaufman, Y. J. and Tanre, D., 1992, Atmospherically resistant vegetation index (ARVI) for EOS-MODIS, IEEE Trans. Geosci. Remote Sens. 30:261-270.
Liu, H.Q. and Huete, A. (1995). A feedback based modification of the NDVI to minimize canopy background and atmospheric noise. IEEE Transactions on Geoscience and Remote Sensing, 33, 457−465.
Qi, J., Chehbouni, A.I., Huete, A.R., Kerr, Y.H. and Sorooshian, S. (1994). A modified soil adjusted vegetation index (MSAVI). Remote Sensing of Environment, 48, 119-126.
www.umesc.usgs.gov/reports_publications/psrs/psr_1997_11.html
www.nrcan.gc.ca/earth-sciences/geography-boundary/remote-sensing/fundamentals/1696; date: 19th Feb., 2013
cdn.intechopen.com/pdfs/30811/InTech-Using_remotely_sensed_imagery_for_forest_resource_assessment_and_inventory.pdf
www.nrcan.gc.ca/earth-sciences/geography-boundary/remote-sensing/fundamentals/1258
www.jeb.co.in/journal_issues/201011_nov10/paper_13.pdf
www.nasa.gov/mission_pages/fires/main/post-fire2011.html
Suggested readings
www.atree.org/sites/default/files/pubs/slele/journal-publications/Heller%20et%20al.pdf
www.adascis.be/img/page/results/4_ADASCIS_VITO_Piccard_EO_final_meeting_20110624.pdf
crs.itb.ac.id/media/Jurnal/Refs/Landscape/Forest_RS2005.pdf
www.creaf.uab.es/miramon/publicat/papers/lisboa98/for_fire.htm
Last modified: Saturday, 1 February 2014, 7:20 AM