Site pages
Current course
Participants
General
Module 1: Introduction and Concepts of Remote Sensing
Module 2: Sensors, Platforms and Tracking System
Module 3: Fundamentals of Aerial Photography
Module 4: Digital Image Processing
Module 5: Microwave and Radar System
Module 6: Geographic Information Systems (GIS)
Module 7: Data Models and Structures
Module 8: Map Projections and Datum
Module 9: Operations on Spatial Data
Module 10: Fundamentals of Global Positioning System
Module 11: Applications of Remote Sensing for Eart...
Lesson 32 Water Resources and Flood Damage Assessment
32.1 Water Resources and Water Quality Detection
Water is a precious commodity which is rapidly becoming scares. The demands for water made by agriculture, industry and for human and cattle consumption is increasing rapidly, particularly with the global increase in population. Therefore, the optimum use of water resources is absolutely essential and this can be done by adopting suitable management practices and preventing wastage caused by uncontrolled runoff. According to Central Water Commission report, after allowing for evaporation losses etc. the countries estimated water potential from surface flow is 1,800 cubic km and all this is carried by the various river systems in the four or five months in a year of the monsoon season.
Remote sensing & GIS applications have been operationalized in most of the natural resources themes and at present that trend is on integrated approach to arrive at sustainable development packages. With the specific problems such as high runoff, shallow ground water, soil erosion etc from hilly areas. The use of remote sensing becomes highly relevant for the development and management of water resources of such regions. Remote sensing & GIS techniques have been applied in several locations for identifying the suitable locations of water harvesting structures. Padmavathy et al, 1992, used GIS for identifying check dams sites in Alur taluka of Hasan district in Karnataka. They selected second and third order streams from the drainage map and superimposed over lineament (fracture) map to avoid fracture zones. Based on the different themes and different weightages were assigned for water spread area and immediate downstream area. Based on the normalized cumulative weighted index the sites were selected after verifying through field checks.
Ground water is a dynamic renewable natural resource, its availability with good quality and quantity in appropriate time and space is of significant importance. As a result of population explosion, urbanization and deforestation, there is continuous pressure on it. Advent of satellite Remote Sensing and Geographic Information System (GIS) has added a new dimension in the field of ground water investigations. Although ground water investigation through satellite data and aerial photographs are indirect approach and involve complex job, when it is integrated with field data (e.g. thickness of weathered zone, surface fractures, faults, depth to water level, seasonal water level fluctuations, water quality and tubewell discharge) in a GIS environment, one can get a fairly accurate idea about ground water of the area by preparing “Hydromorphological (HMG)” maps (Roy 1993, Jugran 1995, Rao et al, 1992; Shah et al, 1992)
Locating and delineating with remote sensing data are done most easily in NIR wavelength because of the absorption property. However, various conditions of water bodies manifest themselves primarily in visible wavelengths. Clear water absorbs little energy having wavelengths less than 0.6 μm. High transmittance typifies these wavelengths with a maximum in blue-green portion of the spectrum. However, as the turbidity of the water changes (because of the presence of organic or inorganic materials), transmittance and therefore reflectance changes dramatically. For example, waters containing large quantities of suspended sediments resulting from soil erosion normally have much higher visible reflectance than other clear waters of the same geographical area. Similarly, reflectance of water changes with the chlorophyll concentration involved. Similarly, concentration of algae has been monitored using remote sensing data. The use of remote sensing and GIS in monitoring water quality parameter such as suspended matter, phytoplankton, turbidity, and dissolved organic matter has been long recognized. The spectral characteristics of the signal received from water are a function of hydrological, biological and chemical characteristics of water, and other interference. Suspended sediments increase the emergent radiance from surface waters in the visible and near infrared proportion of the electromagnetic spectrum. Materials that form films on the water surface, such as oil films, can also be detected through the use of satellite images.
As an example Landsat imageries are also very useful in water quality measurement. The first four bands (TM1, TM2, TM3 and TM4) and thermal band (TM7) are correlated with some water quality parameters, temporal variations of water bodies. It found that atmospheric correction was essential to water quality assessment using satellite remotely sensed imagery because it improved significantly the water reflectance. Band rationing and regression analysis can be utilized for water quality monitoring. The ratio of TM1/TM3 is the most effective in estimating chlorophyll α. In other studies it has been found that TM Band 2, Band 3/Band 2, Band 4/Band 3, and a multivariate regression analysis using Bands 3 and 2 are best in turbidity mapping.
Newly developed hyperspectral imaging, which can simultaneously record in 100s of spectral bands, is a much more powerful tool. Hyperspectral imaging has greater potential because of its simultaneous collection of images covering many narrow, contiguous wavelength bands that allow various aspects of water quality to be measured and monitored. Each water quality parameter such as suspended matter, phytoplankton concentration, turbidity, and dissolved organic matter has their own reflectance value within the range of 400-850 μm.
Spectral signatures of suspended sediments in the lake water have been correlated with the satellite image data. Different concentration of suspended sediments in the lake water is shown in the Landsat TM image data (Fig. 32.1.).
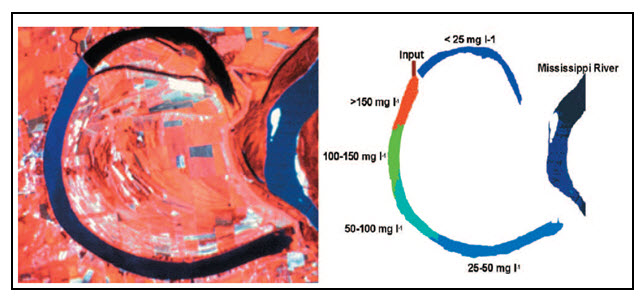
Fig. 32.1. Landsat TM image of Lake Chicot, Arkansas (left) and a derived image (right) showing categories of suspended sediments mapped in Lake Chicot based on the radiance in the TM image.
(Source: www.asprs.org/a/publications/pers/2003journal/june/2003_jun_695-704.pdf)
32.2 Flood Inundation Delineation and Damage Assessment
Several flood events turned out to be the most devastating catastrophes for India’s population, economy and environment during the past decades. Identification of flood affected areas is an important input for taking up flood management schemes for alleviating the problems affected by floods. Mapping the extent of flood by using optical, radar, digital elevation model (DEM), and river gauge data, supported and verified by ground observations, has received increased attention because of the availability of these data sets and the effectiveness of using the data for emergency responses. Analysis of satellite remote sensing is a powerful tool for identification and quantification of water spread area. The growing availability of multi-temporal satellite data has increased opportunities for monitoring large rivers from space, (Manushree & Rao, 2010). A variety of passive and active sensors operating in the visible and microwave range image data can be used to estimate inundation area and delineate flood boundaries. It also appears to be possible to obtain estimates of river discharge from space, using ground measurements and satellite data to construct empirical curves that relate water surface area to discharge. Extrapolation of these curves to ungauged sites may be possible for the special case of braided rivers.
VIR sensors provide good delineation of inundated areas, where clouds, trees and floating vegetation do not obscure the water surface. Whereas the Synthetic Aperture Radar (SAR) sensors emitted microwave signal can penetrate clouds and can also detect standing water through emergent aquatic plants and forest canopies. Cloud penetration is particularly important for monitoring flood events, as they commonly occur during periods of extended rainfall. However, interpretation of synthetic aperture radar (SAR) imagery is less straightforward than for the visible/infrared range.
32.2.1 Flood inundation delineation using VIR data
The spectral reflectance curves of water, vegetation and soil are shown in Fig. 32.2. From the Fig 32.2, it should be noted that water has almost no reflectance in the infrared region, when vegetation, soil reflection continues. The spectral signature of water and other features can be used in flood inundation delineation. In a Landsat image data, the TM 4 band is very useful in identifying land and water boundaries. But confusion arises between the reflectance of water with asphalt areas i.e. road pavement and rooftops of building as they reflect little back to sensor and appeared black on the TM 4 image. It was found that on the TM 7 band the reflectance of water, paved roof surfaces and rooftops are different and on TM 5, the differences are slightly smaller than those are in TM 7. Hence the addition of TM 4 and TM 7 (i.e. TM 4+TM 7) will be useful for determining water verses non water area. If the reflectance of a pixel is low in TM 4+TM 7 image the pixel is considered as water, otherwise it will be represented as non water features. However aerial photographs, DEM, water level measurements and high water marks after flood events are required for the aid of analysis and interpretation.
Generally for flood mapping two sets of remotely sensed data are required: one set consisting of data acquired before the flood event and the other acquired during the flood occurrence. The image before the flood usually used as the reference. One basic way of flood inundation delineation using passive multispectral data is by computing the threshold DN values, creating map and then creating a change detection map between pre flood and during flood scenarios. A methodology for flood mapping is shown in Fig 32.3. The output image generated after application of the methodology in the city of Greenville, Pit County located in the coastal flood plain of North Carolina, USA is shown through Fig. 32.4.
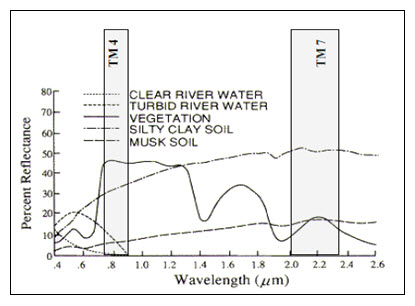
Fig. 32.2. Spectral reflectance curve of water, vegetation and soil.
(Source: www.ualberta.ca/~mdzahidu/flood_mapping.pdf)
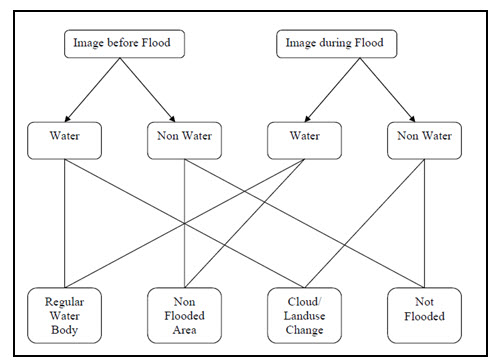
Fig. 32.3. Determination of flooded and non flooded area.
(Source: www.ualberta.ca/~mdzahidu/flood_mapping.pdf)
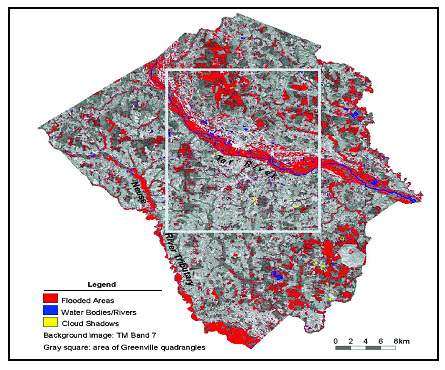
Fig. 32.4. Flood mapping output map generated through landsat data.
(Source: www.ualberta.ca/~mdzahidu/flood_mapping.pdf)
32.2.2 Flood inundation delineation using microwave data
Active remote sensing data such as Synthetic Aperture Radar (SAR) data is also useful for mapping floods because of their all weather functionality, their independency from sun as the illumination source and ability of penetration through forest canopy at a certain frequencies and polarization. In SAR system microwave radiation is produced which transmitted to the target object or area. The amount of microwave energy returned to the sensor is heavily dependent on the surface roughness and the dielectric constant of the elements. The wet and rough ground surface yield strong backscatter than the dry surface. As open water usually exhibit strong specular reflection, so they produce low backscatter and appear dark.
Thresholding method is a very effective method to delineate flooded areas using SAR data. Commonly, a threshold value of radar back scatter is set in decibel (dB) and a binary algorithm can be used to determine whether a given raster cell is ‘flooded’ or not. A major problem is associated with the relation between radar wavelength and roughness of the terrain and water body. Normally calm water acts as a specular reflector to the radar signals, therefore appears in dark. But during floods, due to windy condition wind induced ripples appear in the water surface makes the water rough which appears brighter tone in the SAR image.
A case study carried out by Manushree and Rao, 2010 in a coastal floodplain of Krishna river in Andhra Pradesh using ENVISAT data. The methodology of the study was as follows- first the SAR images (before and after cyclone) were processed by methods which include calibration, multi looking, speckle filtering, slant range to ground range conversion, Geo-coding. A pixel-based classification was used to classify both scenes (i.e., before and after cyclone) into different categories. A Decision tree model was prepared based on backscattering coefficients of different classes, which was used to identify the area inundated by the flood. The pre and post-flood SAR images are shown through Fig. 32.5. (a) and (b).
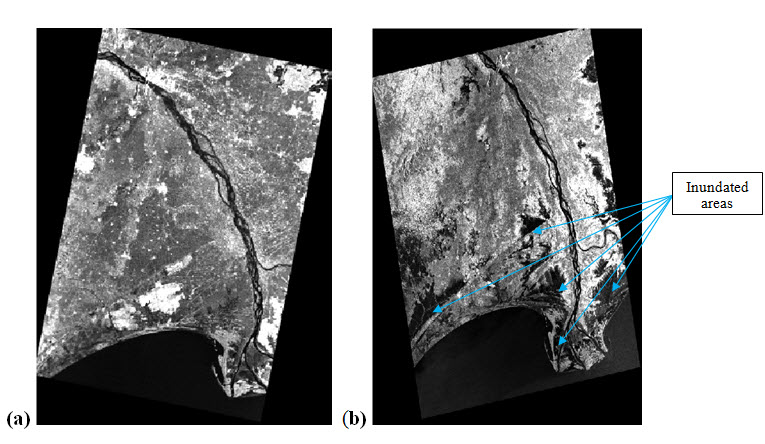
Fig. 32.5. (a) Geo coded image of 4th April, 2006 (pre flood), (b) Geo coded image of 4th Nov, 2006 (post flood). (Source: Manushree and Rao, 2010)
Areas inundated due to flood are shown in Fig. 32.5. (b). areal extent of flood and corresponding damage can be assessed. The recurrence of flood can be avoided through proper planning using these images.
Keywords: Water quality, Turbidity, Chlorophyll, Temperature, Landsat, Flood inundation, SAR.
References
Manushree and Rao, E. P., 2010, Floodplain Inundation Delineation using Synthetic Aperture Radar Data, National Workshop on Coastal Urban Flood Hazards & Management, IIT Bombay, February 19 - 20, 2010.
Jugran D. K., Roy A. K., Khare Poonam and Salim A., 1995, Use of remote sensing and GIS for ground water exploration – An experimental study from western part of Doon valley. Proc. Nat. Symp. for Environmental Monitoring and Management with Special Emphasis on Hill Regions, Dehradun, India.
Padmavathy, A. S., Raj. K. G., Yogarajan. N., Thangavel. P., Manikiam B., Chandrasekhar M. G., 1992, Modelling through GIS for Surface Water Harvesting, Proc. National Symposium on Remote Sensing for Sustainable Development, ISRS, Remote Sensing Application Center, Lucknow, 17-19 Nov, 1992: 193-198.
Rao, M. B. S., Halder. A. L., Rajiva M., 1992, Groundwater Targeting in Lalitpur District, U. P. through Digital Image Processing – A Case Study, Remote Sensing Applications Centre, Jhansi, UP, India, Proc. National Symposium on Remote Sensing for Sustainable Development, ISRS, Remote Sensing Application Center, Lucknow, 17-19 Nov, 1992: 151-158.
Roy A. K. and Ray A. K. Champati, 1993, Ground water investigation using remote sensing and GIS techniques- A case study in Manbazar-II, Purulia (W. B.). Proc. Symp. of Morth Eastern region, Guwahati, Indai.
Shah , P. N., Mohan Rajiva, Rao. D. N., Rao. M. B. S., Ravi Prakash. S., Goswami. N. K., Murthy. C. D., Agarwal. A. K., Mukharjee S., 1992, District wise Hydrogeomorphological Mapping for Sustainable Development of Groundwater in Uttar Pradesh using IRS-IA LISS II Data, Remote Sensing Applications Centre, UP-Lucknow, Proc. National Symposium on Remote Sensing for Sustainable Development, ISRS, Remote Sensing Application Center, Lucknow, 17-19 Nov, 1992: 144-150
www.asprs.org/a/publications/pers/2003journal/june/2003_jun_695-704.pdf
www.ualberta.ca/~mdzahidu/flood_mapping.pdf
Suggested Reading
www.scribd.com/doc/28668587/Remote-Sensing-Applications-for-Water-Resources
unesdoc.unesco.org/images/0018/001880/188045m.pdf
cdn.intechopen.com/pdfs/13165/InTech-Monitoring_of_water_quality_using_remote_sensing_data_mining.pdf
courses.nus.edu.sg/course/geoluxx%5Cnotes/Sanyal%20Joy%20in%20Natural%20Hazards.pdf
Last modified: Saturday, 1 February 2014, 8:22 AM