Site pages
Current course
Participants
General
Module 1: Introduction and Concepts of Remote Sensing
Module 2: Sensors, Platforms and Tracking System
Module 3: Fundamentals of Aerial Photography
Module 4: Digital Image Processing
Module 5: Microwave and Radar System
Module 6: Geographic Information Systems (GIS)
Module 7: Data Models and Structures
Module 8: Map Projections and Datum
Module 9: Operations on Spatial Data
Module 10: Fundamentals of Global Positioning System
Module 11: Applications of Remote Sensing for Eart...
Lesson 30 Land Use and Land Cover Mapping and Change Detection
30.1 Land Cover Mapping
Land cover refers how much of a region of the earth surface is covered by forests, wetlands, impervious surfaces, agriculture, water body etc. Water body includes wetlands or open water. Whereas land use shows how people use the land – whether for social-economic development, conservation, or mixed uses.
Land cover can be identified and mapped using satellite remote sensing data in a short time over a large area at a time. These maps help planners and managers to understand about the current landscape which helps them to evaluate past management decisions as well as gain insight into the possible effects of their current decisions before they are implemented. As an example, coastal managers use land cover data and maps to understand the impacts of natural phenomena and human use of the landscape. Maps can help managers to assess urban growth, model water quality issues, predict and assess impacts from floods and storm surges, track wetland losses and potential impacts from sea level rise, prioritize areas for conservation efforts, and compare land cover changes with effects in the environment or to connections in socio-economic changes such as increasing population.
A simple land cover land use map can be prepared by supervised or unsupervised techniques or combination of both. The output map depends on the spectral, spatial and radiometric resolution of the image data set. The basic need of an image classification is a general knowledge about the landscape of the study area, post classification field verification and accuracy assessment. The steps to generate land use land cover map are shown through flowchart in Fig 30.1.
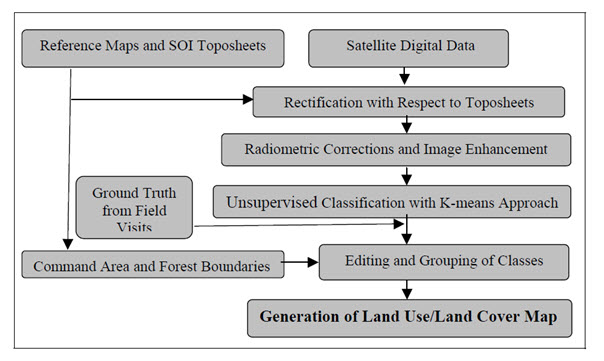
Fig. 30.1. Flowchart generation of land use land cover map.
(Source: Gontia, 2005)
The study has been carried out for irrigation planning using remote sensing and GIS for wheat crop grown in Tarafeni South Main Canal command (TSMC), (Gontia, 2005). A land use land cover map classification generated for TSMC is shown in Fig 30.2. The corresponding error matrix and accuracy assessment carried out are given in the Table 30.1 and Table 30.2 respectively.
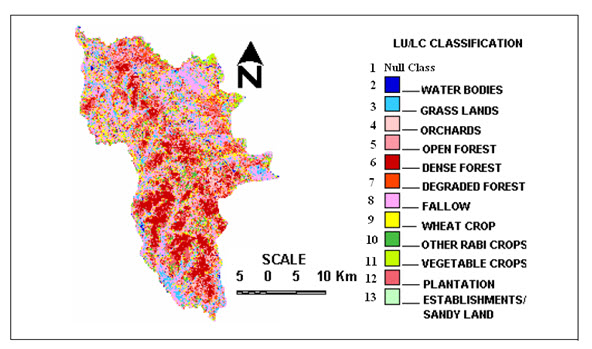
Fig. 30.2. Land use land cover classification map of an area.
(Source: Gontia, 2005)
Table 30.1 Error matrix of the classified image
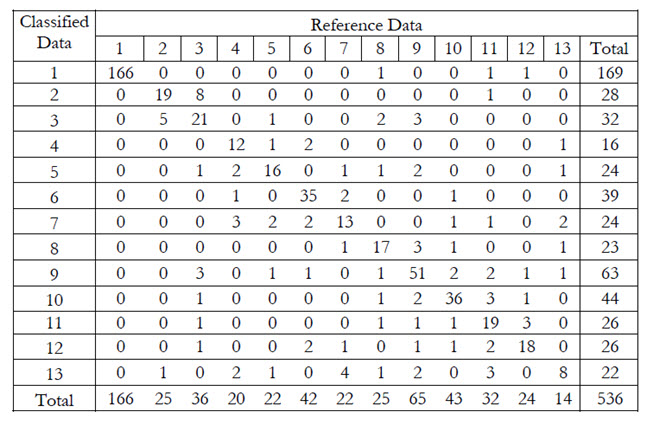
(Source: Gontia, 2005)
Table 30.2 Accuracy statistics of land use land cover classification
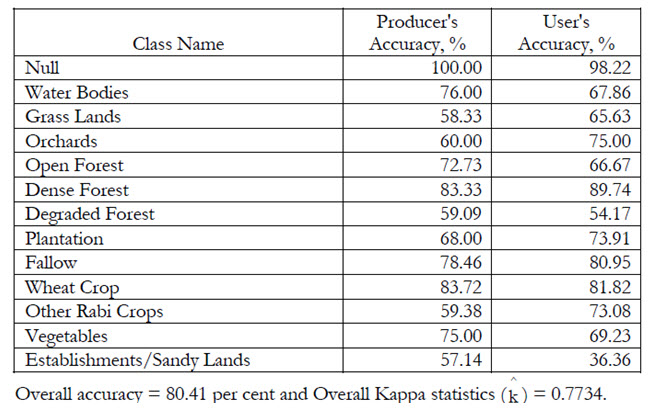
(Source: Gontia, 2005)
30.2 Land use/Land Cover Change Detection
Land use and land cover is an important component in understanding the interactions of the human activities with the environment and thus it is necessary to simulate changes. Land use and land cover are dynamic in nature. Land use and land cover (LULC) change is a major issue of global environment change. Changes may be natural or manmade for land use land cover modification. Land degradation also takes place due to increased human activity without proper management practices. Changes in landuse can be due to urban expansion and the loss of agriculture land, changes in river regimes, the effects of shifting cultivation, the spread of erosion and desertification and so on. This, therefore, requires not only the identification of features but also the comparison of subsequent data in order to recognize when valid change has taken place. The land use change has a direct bearing on the hydrologic cycle. Various hydrologic processes such as interception, infiltration, evapotranspiration, soil moisture, runoff and ground water recharge are influenced by landuse landcover characteristics of a catchment. Application of remotely sensed data made possible to study the changes in land cover in less time, at low cost and with better accuracy in association with Geographical Information System (GIS) that provide suitable platform for data analysis, update and retrieval helps in monitoring, mapping and management of natural resources.
A number of techniques for accomplishing change detection using satellite imagery can be used, which are broadly grouped into two general types: (1) those based on spectral classification of the input data such as post-classification comparison and direct two-date classification; and (2) those based on radiometric change between different acquisition dates, including (a) image algebra methods such as band differencing, ratioing, and vegetation indices; (b) regression analysis; (c) principal component analysis; and (d) change-vector analysis (CVA).
Chen. et al. (2003) stated the methodology of change-vector analysis (CVA) which is shown through Fig. 30.3. The output image generated using CVA method is given in Fig 30.4.
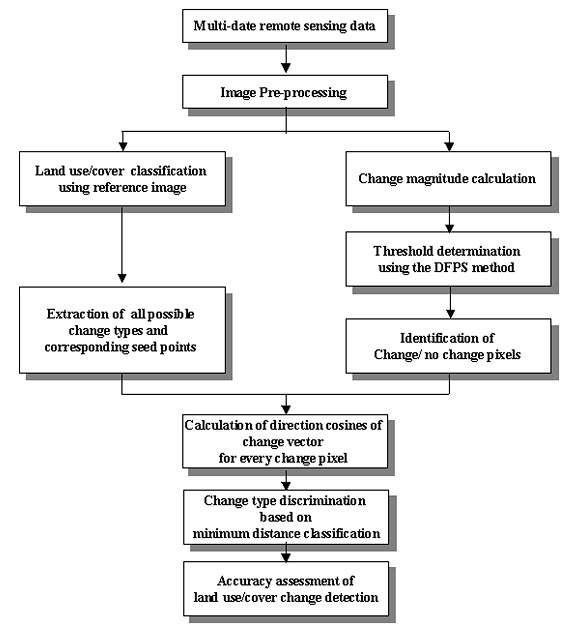
Fig. 30.3. Flowchart of land-use/land-cover change detection based on improved change vector analysis.(Source: Chen, et al., 2003)
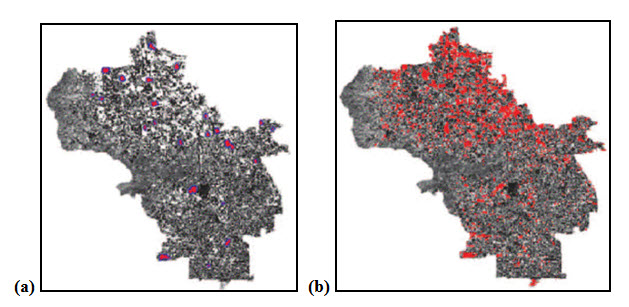
Fig. 30.4. The selected change sample areas and results of change/no-change detection. (a) Typical change sample areas (red) with outer no-change buffer boundary (blue). (b) Change pixels detected by the improved CVA method.
(Source: Chen, et al., 2003)
Another study on land use land cover change detection has been carried out for Tarafeni catchment of West Bengal by Jena (2002). The output change detection map and statistics of obtained through analysis of satellite image of Tarafeni catchment are given in Fig. 30.5 and Table 30.3.
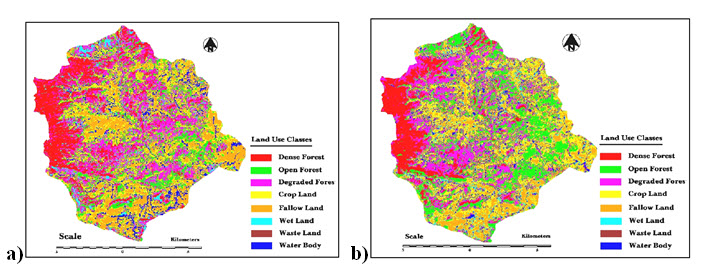
Fig. 30.5. Land cover land use map of Tarafeni catchment of year (a)1989, (b)2000.
(Image Source: Jena, 2002)
Table 30.3 Land use land cover statistics of Tarafeni catchment
|
Land use land cover Type |
Area (ha.) |
|
|
Year 1989 |
Year 2000 |
|
|
Dense forest
|
2715.0 |
1874.9 |
|
Open forest |
2109.6 |
3046.6 |
|
Degraded forest |
3337.0 |
2932.7 |
|
Cropland |
1961.6 |
2207.0 |
|
Fallow land |
4029.8 |
3815.4 |
|
Wet land |
605.07 |
639.40 |
|
Waste land |
0.00 |
367.9 |
|
Water bodies |
1048.1 |
922.13 |
(Source: Jena, 2002)
From the Table 30.3 it can be observed that in 11 years open forest, crop land, wet land and waste land have increased, where as dense forest, degraded forest, fallow land, water bodies have decreased. Such information can be used for planning purpose.
Keywords: Land use land cover, Change detection, Change-vector analysis (CVA), Supervised classification, Accuracy assessment.
References
Chen J., G. P., H. C., P. R., S. P., April 2003, Land-Use/Land-Cover Change Detection Using Improved Change-Vector Analysis, Photogrammetric Engineering & Remote Sensing.
Gontia, N. K., 2005, Crop Water Stress Indices and Evapotranspiration Estimation for Irrigation Scheduling and Yield Modelling of Wheat Crop Using Remote Sensing and GIS, PhD thesis submitted to IIT Kharagpur.
Jena, S. K., 2002, Development and evaluation of hydrological models for agricultural watersheds using remote sensing and GIS, PhD thesis submitted to IIT Kharagpur.
www.ijest.info/docs/IJEST10-02-12-058.pdf
Suggested Reading
www.ipublishing.co.in/jggsvol1no12010/EIJGGS1015.pdf
www.ijest.info/docs/IJEST10-02-12-058.pdf
www.isprs.org/proceedings/xxxviii/4-c7/pdf/Malinverni-110.pdf
www.scangis.org/scangis2007/papers/e10_rymasheuskaya.pdf
Last modified: Saturday, 1 February 2014, 7:39 AM